
PDHL
Индикатор
1.84K скачивания
Версия 1.0, Sep 2024
Windows, Mac
2.5
Отзывы: 2
Описание
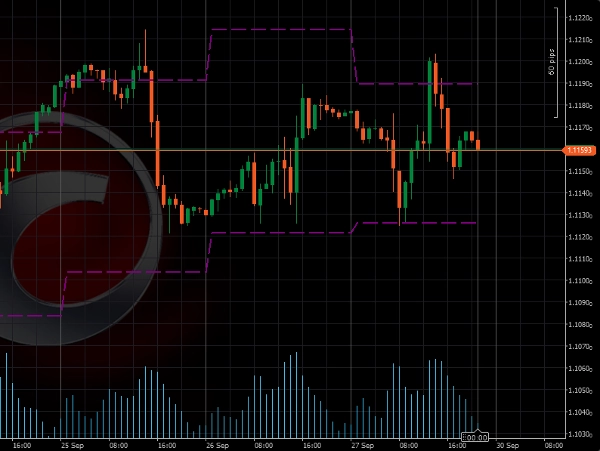
Представляем индикатор High-Low Trading
Этот индикатор предназначен для автоматического отображения на вашем графике максимальных и минимальных цен предыдущего дня. Этот инструмент помогает быстро определить ключевые уровни для потенциальных прорывов и разворотов.
Основные преимущества:
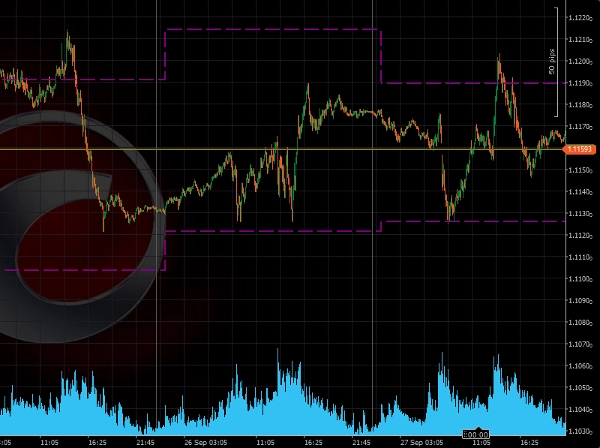
- Идеально для торговли прорывами: этот индикатор выделяет критические ценовые уровни предыдущего дня, которые часто используются в качестве ориентиров для стратегий прорыва. Торговля прорывами выше или ниже этих уровней может предложить высокопотенциальные возможности.
- Просто и эффективно: индикатор High-Low Trading сосредоточен на одном из самых важных аспектов ценового движения — максимуме и минимуме предыдущего дня. Включая эти уровни в свою стратегию, вы получаете более четкое понимание структуры рынка и потенциальных точек разворота.
Внимание:
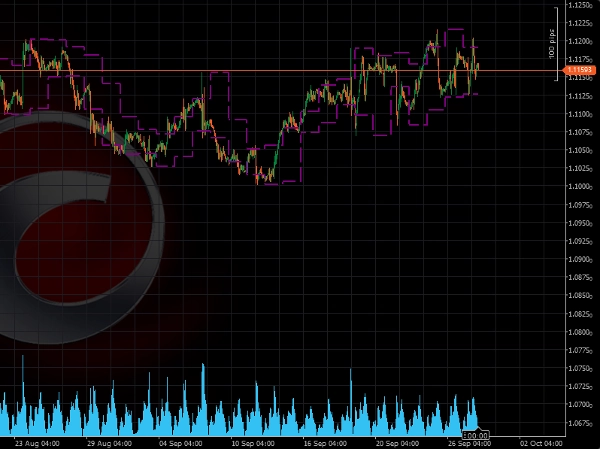
- Лучше использовать на таймфреймах менее 1 дня
Настройки:
- Включать воскресенье: по умолчанию = нет
Сводка
ИИ-сводка
The PDHL (Previous Day High & Low) indicator automatically plots the prior day's highest and lowest price levels on trading charts. It is designed to assist traders in identifying key price levels that may signal potential breakouts or reversals. By highlighting these critical levels, the indicator supports breakout trading strategies, providing reference points for entering trades when price moves above or below the previous day's range. The tool emphasizes simplicity and effectiveness by focusing on essential price action elements, helping traders better understand market structure and potential turning points. It is best used on intraday timeframes shorter than one day. A configurable setting allows users to include or exclude Sunday in the calculation, with the default setting excluding it.
Профиль индикатора
Отзывы покупателей
2.5
Отзывы: 2
5 | 0 % | |
4 | 0 % | |
3 | 50 % | |
2 | 50 % | |
1 | 0 % |
Отзывы покупателей
October 9, 2025
What Timezone is it in at default? It seems to fail to get the accurate Highs and lOws for different istruments. You could add that as a customisable input. Please add closing price too
July 9, 2025
Pros: Simple and clear display of previous day's high/low levels. Stable performance. Easy to use and customize. Cons: No breakout alerts. No visual zone fill option. Lacks additional filters or Fibo levels.
Обсуждение
Частые вопросы
Breakout
Продукты, доступные в cTrader Store, включая торговых ботов, индикаторы и плагины, предоставляются сторонними разработчиками и доступны исключительно в информационных и технических целях. cTrader Store не является брокером и не предоставляет инвестиционные консультации, персональные рекомендации или какие-либо гарантии будущей доходности.
Больше от этого автора


Цена
С 24/09/2024
4.46K
Бесплатные установки