
Описание
▁▂▃▄▅▆▇ █ 10,000+ трейдеров (институциональные + розничные) █ ▇▆▅▄▃▂▁
- Выбирайте наши ТОП индикаторы в cTrader 🏆
- ✨ Эксклюзивная точность для превосходных результатов ✨
- 📈 Наши алгоритмы — с самыми высоко оценёнными визуализациями 🎯—
- успешно внедрены в 2 квантовых фонда
▁▂▃▄▅▆▇ █████████████████████████████ ▇▆▅▄▃▂▁
_______________________________________________
_______________________________________________
📌 Индикаторы структуры рынка
· ✅ AdvancedMarket Structure: Bos, Choch, SwinLevels, Order Blocks, Market Structure& Liquidity Finder
· 🔄 Dynamic Market StructureAnalysis of Turning Points
· 🧱 Order Block
· ⚖️ Market Imbalance
· ⛓️ BOS & CHOCH
· 🧠 ICT Power of 3
______________________________________________________________-
Магазин cBots : 🧠 Gold & BTC BreakoutSession Pivots 🧠
_______________________________________________
🔚 Системы умного выхода
_______________________________________________
📐 Индикаторы ZigZag
· 🔍 ZigZag Price LiquidityProjection
· ➖ ZigZag
_______________________________________________
🧱 Индикаторы поддержки и сопротивления
· 🟩 SmartTrend Support &Resistance Lines
· 🧱 Все уровни поддержки и сопротивления
_______________________________________________
📊 Индикаторы тренда и каналов
· 📊 Supertrend
_______________________________________________
💧 Инструменты объёма и ликвидности
_______________________________________________
⚡ Индикаторы импульса и RSI
· 🔎 Multi-Level Candle BiasTracker
_______________________________________________
🔮 Инструменты прогнозирования и проекции
· 📐 Прогноз на основе Linreg& ATR
· 📏 Фибоначчи линейная регрессияМульти-таймфрейм
· 📈 Проектор рыночного потока на основе объёма
______________________________________________________________________________________________________
ДВИГАТЕЛЬ ВЕРОЯТНОСТИ РАЗВОРОТА 🔄
Гибридный индикатор для обнаружения зон разворота + многомерное отображение уровней поддержки и сопротивления "Золотые уровни". Он объединяет анализ структуры (максимумы/минимумы окна Фибоначчи), динамику (скорость и ускорение цены), энтропию/хаос (порядок против беспорядка), импульс и объём для генерации:
- Иерархические уровни поддержки/сопротивления по временным горизонтам.
- Вероятностные сигналы потенциального разворота (вершины и впадины) с % уверенностью. ⚠️
- Активные зоны (прямоугольник) для контекстуализации сделок и стопов.
- Кластеры совпадений (когда несколько таймфреймов совпадают по одной цене). 🎯
2. Цель
Снизить визуальный шум и облегчить принятие решений, выявляя:
- Где цена была сжата или закреплена на разных горизонтах.
- Где статистическая вероятность разворота увеличивается (подтверждённый или ожидаемый). 📊
- Какие уровни имеют наибольший "вес" (совпадение).
3. Концептуальная логика
a) Уровни: Для каждого окна Фибоначчи берутся последние максимумы (R) и минимумы (S); это обеспечивает фрактальный масштаб контекстов (ультракороткий до макро).
b) Объединение: Если несколько разных уровней попадают в X пипсов, они группируются → кластер с объединённой меткой и счётом совпадений.
c) Сигналы разворота: Ищутся локальные паттерны истощения (форма волны), замедление (изменение наклона), падение низкой энтропии (низкая энтропия = более направленное движение, склонное к развороту), возможные внутренние дивергенции и подтверждения импульса/объёма.
d) Прогностический режим: Позволяет предвидеть развороты (бриллиант) до полного подтверждения, если совпадают противоположное ускорение + низкая энтропия + экстремальное состояние. 💎
e) Вероятность: Нормализованный вес различных факторов (тренд, хаос, импульс, объём, дивергенция, адаптация). Усечённый результат 40–99%.
f) Активная зона: После сигнала ищется наиболее логичный диапазон (между релевантными уровнями) для управления сделкой и контекстуализации стопов.
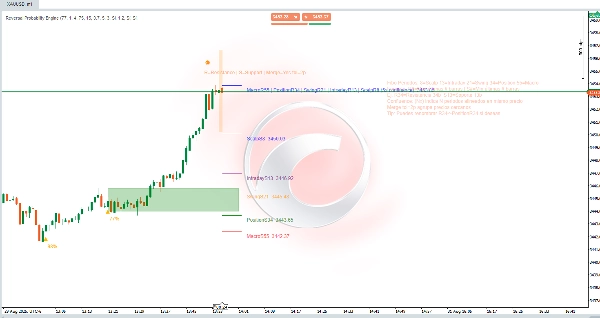
4. Визуальные компоненты
- Горизонтальные линии: Уровни по периоду (Scalp 8, Intraday 13, Swing 21, Position 34, Macro 55). Постоянный цвет для каждого горизонта.
- Метки R#/S#: R = сопротивление (последний максимум окна), S = поддержка (последний минимум). Например: R34 = сопротивление, полученное из последних 34 свечей.
- Объединённые метки:
ScalpS8 | IntradayS13 | … (5x confluence) Price. Указывает, что N разных периодов дают один и тот же уровень (или в пределах допуска). Чем больше, тем выше релевантность. ✅ - (Nx confluence): Количество совпадающих периодов.
- Допуск объединения tol=Xp: Допуск в пипсах, который группирует близкие уровни (избегает насыщения).
- Вероятности (%): Текст над/под треугольниками (Вниз / Вверх) или бриллиантом (раннее обнаружение).
- Зелёный прямоугольник (активная зона): Динамический операционный канал, где оценивается развитие после сигнала.
- Дополнительные тонкие блоки/цвета: Элементы поддержки (волны/частицы), если активированы.
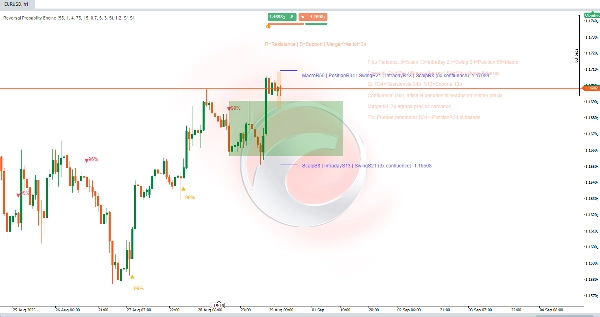
5. Практическая интерпретация
- Высокое совпадение (≥3x) = сильный "магнит" или уровень поворота; следите за реакцией цены. 🧲
- Сигнал + близкое совпадение усиливает достоверность (но не гарантирует).
- Вероятность ≥ мин. уровень уверенности %: Минимальный фильтр для рассмотрения действия.
- Различать ожидаемый (бриллиант) и подтверждённый (треугольник): Ожидаемый предлагает лучший риск/вознаграждение, более высокий уровень ложных срабатываний; подтверждённый приходит с меньшей асимметрией, но большей валидацией.
- Прямоугольник: Если цена остаётся внутри и не нарушает противоположный край, гипотеза остаётся в силе; чистый пробой снижает ожидания.
- Расширять или уменьшать допуск объединения: Меньше = большая детализация, Больше = более синтезированные кластеры.
6. Последовательность использования
- Загрузите индикатор на нужный инструмент и таймфрейм.
- Настройте мин. уровень уверенности % в зависимости от терпимости (например, ниже для скальпинга, выше для свинга).
- Проверьте, появляется ли кластер поддержки/сопротивления (5x, 4x и т.д.).
- Ожидайте сигнала (идеально, если он возникает на периферии кластера и с высокой вероятностью). 🔔
- Ограничьте управление в активной зоне: ступенчатый вход или подтверждение неудачного пробоя.
- Определите логичный стоп: за первым нижним (для лонга) или верхним (для шорта) уровнем, отсутствующим в совпадении.
- Деактивируйте периоды, которые не используете (например, только Swing/Macro для длинных позиций).
- Настройте допуск и, при желании, скройте пояснительную панель после изучения.
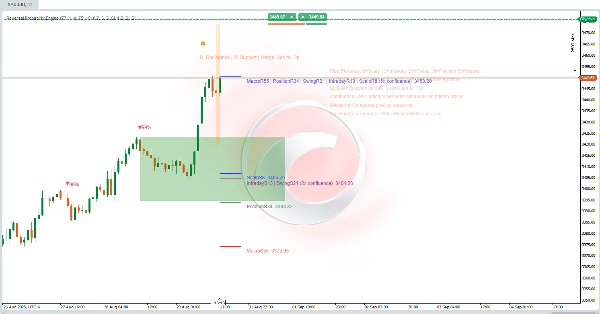
7. Пример быстрого чтения метки
ScalpS8 | IntradayS13 | SwingS21 | PositionS34 | MacroS55 (5x confluence)
Значение: Все таймфреймы (8–55) имеют одинаковый уровень → многоуровневая структурная поддержка. Более высокая вероятность реакции; если уровень потерян с объёмом, это означает более серьёзное изменение режима. 🚨
Сводка
Key features include:
- Hierarchical support and resistance levels categorized by time horizons (from ultra-short scalp to macro scales).
- Probabilistic reversal signals indicating potential peaks and valleys with confidence percentages.
- Active zones displayed as rectangles to help contextualize trade entries and stop placements.
- Confluence clusters that highlight price levels confirmed across multiple timeframes, enhancing level significance.
The indicator reduces visual noise by grouping nearby levels within a tolerance range and provides clear visual components such as horizontal lines, labeled resistance/support points, merged confluence labels, probability percentages, and active zones. It distinguishes between anticipated and confirmed reversal signals, offering traders options for risk management and trade timing.
Users can adjust confidence thresholds and merge tolerances to tailor granularity and filtering according to their trading style and timeframe. The tool supports structured decision-making by identifying statistically significant reversal areas and multi-scale support/resistance clusters on any instrument and timeframe.
Отзывы покупателей
5 | 0 % | |
4 | 0 % | |
3 | 0 % | |
2 | 0 % | |
1 | 100 % |


![Логотип продукта "Gaussian Channel [Iridio Capital]"](https://cdn.ctrader.com/image/webp/7c039209-5573-4a54-a072-f9528b503103_41960)

