
Açıklama
1. Hyper Trend nedir ve kimler içindir
Hyper Trend, c Trader için bir trend takip eden üst gösterge. Size tek, kolay okunabilir bir takip eden trend çizgisi, bu trende katılmak için bir referans bölgesi, net sinyal işaretleri, isteğe bağlı grafik üzerinde stop-loss / take-profit çerçevesi ve etkileşimli bir panel sunar, böylece ayarları yeniden açmadan gördüğünüz çoğu şeyi canlı olarak ayarlayabilirsiniz.
Tasarım hedefi kasıtlı olarak basittir: iyi kurulmuş ticaret yöntemlerini alıp gerçekten kolay okunabilir trendler ve sinyaller üretmek — sonra tüm sistemi hafif, müdahale etmeyen ve hızlı kurulabilir yapmak.
Deneyim fark etmeksizin her tür tüccar için uygundur.
-
-
- Yeni başlayanlar yön ve risk hakkında temiz bir okuma elde eder.
- Deneyimli tüccarlar, kendi fiyat okumalarına müdahale etmeyen hızlı, yapılandırılabilir bir üst gösterge elde eder.
-
Yüzeyde basit ve verimli olacak şekilde inşa edilmiştir, ancak altında araştırılmış uygulamalara dayanır ve kurulumu ve ince ayarı kolaydır.
"Ne ticaret yaparsanız yapın ve ne kadar deneyimli olursanız olun, Hyper Trend okunması kolay, kurulumu kolay ve ince ayarı kolay olacak şekilde tasarlanmıştır."
2. Arkasındaki fikir
Hareketli ortalamalar, ATR, Super Trend, yumuşatma filtreleri — bunlar iyi bilinen, yerleşik
yöntemlerdir ve tam olarak Hyper Trend'in yaptığı şeyi yaparlar: ham fiyatı okunabilir bir
trende ve kullanılabilir sinyallere dönüştürmek.
Peki neden başka bir araç? Çünkü pratikte, bu alandaki çoğu gösterge aynı
problemleri paylaşır:
-
-
- Yeniden paketleme. Yayınlananların çoğu aynı veya eski mantığın yeniden adlandırılması ve
tekrar tekrar yayınlanmasıdır, altında gerçekten yeni çok az şey vardır. - Grafik karmaşası. Birçoğu grafik üzerine o kadar çok şey yığar ki fiyatın kendisini okumak neredeyse
imkansız hale gelir ve iç mantıkları bazen tüccarın gerçek
niyetine karşı çalışır. - Azalan avantaj. Temel kavramlar iyi görünür, ancak günümüzün hızla gelişen
piyasalarında — özellikle daha hızlı zaman dilimlerinde — gerçek bir avantaj sağlamada başarısız olurlar.
- Yeniden paketleme. Yayınlananların çoğu aynı veya eski mantığın yeniden adlandırılması ve
-
Hyper Trend bu üçüne karşı koymayı amaçlar. Yerleşik omurgayı (yumuşatma,
volatilite bantları, Super Trend tarzı yön) korur ancak veri ön işleme, fiyat yumuşatma ve sinyal işleme
konusunda daha yeni yaklaşımlar uygular — bilimsel makalelerde, ticaret dergilerinde ve akademik araştırmalarda tartışılan türden teknikler. Tüm referans bağlantıları video açıklamasında bulunabilir.
KAYNAK REFERANSLARI
- ECB: A TREND-CYCLE(-SEASON) FILTER
- Kalman filtresi açıklaması: sezgiden olasılıksal grafik modele ve finansal piyasalarda gerçek vaka
- Sürekli Zamanda Finansal Fiyatlandırma Modelleri ve Kalman Filtreleme
- Holt-Winters filtresi ve tek taraflı HP filtresi: Yakın bir karşılık
- Trend ve Mevsimsellik Ayrıştırması için Bayes Çerçevesi
- Hedge Fon Getirileri, Kalman Filtresi ve Değişkenlerde Hatalar
- Finansal Veri Yumuşatma için Hareketli Ortalamalar
- Fraktal Adaptif Hareketli Ortalama Stratejisinin Performansını Optimize Etme: EUR/USD Örneği
- Regresyon Modeli ile Türetilmiş Kalman Filtresi ve Optimal Yumuşatma
Amaç pratikte basit bir soruyu test etmektir: bu teorik kavramlar,
yerleşik araçların üzerine uygulandığında, tüccarın lehine gerçek bir avantaj sağlayabilir mi? Hyper Trend bunun somut bir örneğidir — yerleşik yöntemler, önemli yerlerde modernize edilmiş, okunabilirlik birinci sınıf özellik olarak ele alınmıştır, sonradan düşünülmemiştir.
"Aynı güvenilir temeller — ortalama alma, volatilite, trend mantığı — ancak modern ön işleme ve grafiği okunabilir tutmaya amansız odaklanma ile."
3. Temel noktalar — onu farklı kılan
Tasarım gereği müdahale etmeyen bir üst gösterge. Fiyatın üzerinde gerçekten faydalı olanı göstermek ile okuduğunuz fiyat akışını bozmamak arasında kasıtlı bir denge tutar.
c Trader için optimize edilmiş — hızlı ve hafif. Hızlı yükleme ve düşük CPU kullanımı için tasarlanmıştır ve aynı anda birden fazla örnek bağlı ve çalışırken bile sorunsuz çalışacak şekilde tasarlanmıştır, birden fazla grafik veya sembol üzerinde, böylece platformunuz duyarlı kalır.
Motorun altında temiz bir işlem hattı.
-
-
- Bir fiyat kaynağı seçin. Hesaplamanın hangi fiyat üzerinde yapılacağını seçersiniz — kapanış, HL2 gibi bir orta nokta, HLC3 gibi tipik bir fiyat vb. (kaynak ayarı).
- İsteğe bağlı ön işleme. Bu fiyatı, Heikin-Ashi mumları ve/veya Kalman filtresi üzerinden geçirerek gürültülü serileri yumuşatabilirsiniz — bu "modernize edilmiş işleme" fikrinin bir parçasıdır.
- Yumuşatılmış trend temeli. Seçilen kaynak, geri kalan mantığın üzerine kurulduğu trend temeli oluşturmak için yumuşatılır — baskın hareketi takip etmek için tasarlanmıştır.
- Volatilite bantları. Wilder tarafından yumuşatılmış ATR, bu temelin üstünde ve altında bir bant belirler.
- SuperTrend mantığı. Standart SuperTrend "yapışkanlığı" hangi tarafın aktif olduğunu belirler:
yukarı trendde alt bant takip çizgisi olur; aşağı trendde üst bant olur. Fiyat aktif bandı kapattığında trend değişir.
-
"Grafiğe hafifçe oturacak şekilde tasarlanmıştır — size yardımcı olanı gösterir, olmayanı gizler ve fiyatın kendisine asla engel olmaz. Panelde bir tıklama istediğiniz zaman temiz fiyata geri döner."
4. Grafiği okuma — temel görseller
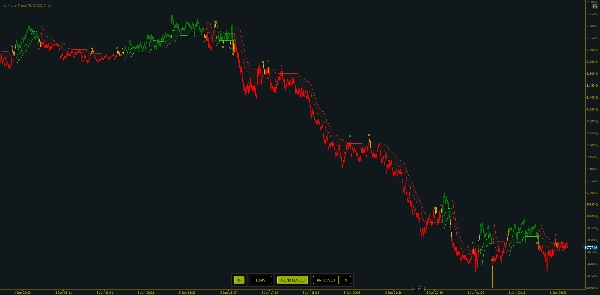
1. Takip eden çizgi
-
- Yeşil = yukarı trend (çizgi fiyatın altında)
- Kırmızı = aşağı trend (çizgi fiyatın üstünde)
- Renk değişimi bir trend değişimidir
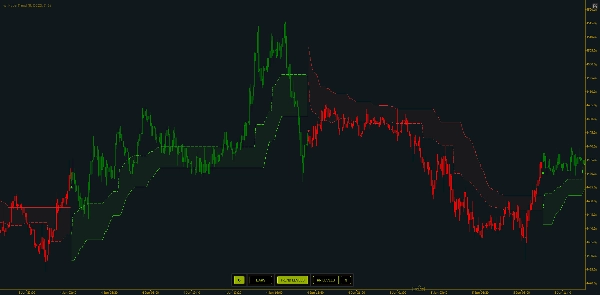
2. Giriş bölgeleri
-
- Etkinleştirildiğinde, noktalı bir seviye takip eden çizgiden karşı bant yönüne doğru bir kısmında durur — mevcut trend içinde "değere geri çekilme" referansı, aşırıyı kovalamak yerine.
Giriş Bölgesi Mesafesibunun ne kadar uzakta olduğunu kontrol eder.
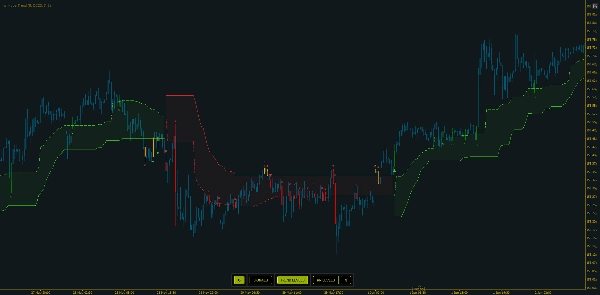
3. Çubuk renklendirme
-
- Çubuklar aktif yöne göre renklendirilebilir, üç stil ile:
-
- Normal (yönüne göre boğa/ayı),
- Mod 1, geçiş aşamalarında farklı bir görselleştirme sağlar
- Mod 2, ayrıca nötr geçiş çubuklarını işaretler.
Görünür yeşil/kırmızı takip eden çizgi nihai çıktıdır. Diğer her şey — giriş
bölgeleri, işaretçiler, SL/TP çizgileri, çubuk renklendirme — aynı yön durumunun üzerine katmanlanır.
"Çizginin rengi, rejim eğiliminizi bir bakışta gösterir; noktalı bölge trendin daha makul bir giriş sunduğu yerdir."
5. Sinyaller ve Uyarılar
Hyper Trend üç sinyal türünü ayırt eder. Her sinyal onaylanmış çubukta etiketli bir işaretçi basar ve bağımsız olarak açılıp kapatılabilir:
-
- Değişim sinyalleri (varsayılan olarak açık) — trend değişim yönü (veya eğilim) tetiklendiğinde. Bu birincil sinyaldir.
- Giriş çaprazı sinyalleri — mevcut trend içinde giriş bölgesi üzerinde doğrulanmış bir tur dönüş çaprazında tetiklenir (fiyat bölgeyi terk eder ve tekrar ele geçirir). Geri çekilme girişlerinin zamanlaması için.
- Trend çaprazı sinyalleri — takip eden çizgi üzerinde doğrulanmış bir tur dönüş çaprazında tetiklenir. Daha zengin renklendirme modunda, geçiş/nötr çubukta trend çizgisi çaprazı yeni girişten çok çıkış tarzı işaretçi olarak değerlendirilir.
- Çıkış sinyalleri — Çubuk Renklendirme - Mod 2 etkinleştirildiğinde görünür, bu sinyaller trendin gücünü kaybettiğini ve değişim sinyallerinden birkaç çubuk önce olduğunu işaretlemeye yardımcı olur. Düşük volatilite ve azalan piyasa katılımı dönemlerini tespit etmek için faydalıdır, bu da kesintili veya aralıkta fiyat hareketi üretir.
Uyarılar: etkinleştirildiğinde, Hyper Trend seçilen bir sesi çalar ve her tespit edilen sinyal için bir açılır pencere gösterir. Uyarılar aynı açma/kapama düğmelerini takip eder — sadece açık olan sinyal türleri uyarı verir — ve grafik üzerindeki panelin uyarı düğmesi bunları canlı olarak açıp kapatır. Açılır pencere özlüdür: sembol ve zaman dilimi, sinyal türü ve yönü, ve mevcut fiyat.
"Temiz bir grafik için sadece değişim sinyali ile başlayın, sonra daha ince giriş zamanlaması istediğinizde çapraz sinyalleri ekleyin. Her biri size ses ve açılır pencere ile bildirim gönderebilir."
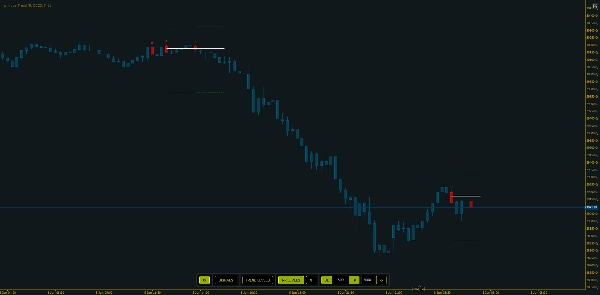
6. İşlemlerinizi planlayın — Grafik üzerinde Risk / Getiri seviyeleri
Stoploss / Hedef seviyeleri açıkken, her sinyal çubuğunda üç kısa yatay çizgi olur: sinyal çubuğunun orta fiyatında bir Giriş çizgisi, kaybedilen tarafta sabit pip mesafesinde bir SL çizgisi ve kazanan tarafta sabit pip mesafesinde bir TP çizgisi.
Seviyeler önceden belirli bir çubuk sayısı kadar uzatılır ve sonrasında daha fazla büyümez — sinyalde anlık görüntüdür. Yeni bir sinyal önceki seti kısaltır böylece seviyeler birbirine karışmaz. Giriş, SL ve TP'nin her biri kendi renge sahiptir, ayarlanabilir çizgi kalınlıkları ve stilleri ile.
"İşlemi görsel olarak çerçeveler — giriş, durdurma, hedef — böylece taahhüt etmeden önce risk-getiri oranını görürsünüz, sonra grafiği kaç setin kaldığını sınırlayarak düzenli tutar."
7. Etkileşimli panel — görselleri canlı değiştirin
Grafik üzerindeki panel, parametreleri yeniden açmadan görüntülenenleri hemen değiştirir.
Aktif açma/kapama düğmeleri vurgulanır; panel her zaman mevcut durumu yansıtır. Grafikte yerleştirmek için birden fazla seçeneğiniz vardır veya tamamen gizleyebilirsiniz.
"Normalde ayarlarda kazmak isteyeceğiniz her şey — renklendirme, trend seviyeleri, risk çizgileri ve SL/TP mesafeleri — panelde bir tıkla. Yeni mesafeleri yazın, yenileye basın ve seviyeler güncellenir."
8. Ticaret yaklaşımları — birkaç örnek
Yaklaşım A — Değişimi ticaret yap (trend takip). Değişim sinyallerini birincil ipucu olarak kullanın: onaylanmış bir dönüşte yeni yönde girin ve takip eden çizgiyi görsel geçersiz kılma olarak kullanın. Karşı renge dönüş çıkış/ters dönüş olur. En basit, en temiz okuma.
Yaklaşım B — Trend içinde geri çekilme girişi. Trend zaten kurulu iken, fiyatın giriş bölgesine geri çekilmesini bekleyin ve çapraz giriş sinyallerini açın, böylece tekrar çaprazlama fiyatın bölgeyi yeniden ele geçirdiği anı işaretler — aşırıyı kovalamak yerine daha iyi değerde trende katılmak için.
Yaklaşım C — Her kurulumda çerçeveli risk. RR Seviyelerini açın, sembolün volatilitesine uygun SL / TP mesafelerini ayarlayın. Taahhüt etmeden önce giriş / durdurma / hedefi görür ve işleminizi buna göre yönetirsiniz.
Üçünde ortak olan yargıdır: trend yönünde hareket edin, çevresel fiyat hareketi ile onaylayın ve çizgiyi referans olarak kullanın — Hyper Trend okumadır, siz işlemi yerleştirir ve yönetirsiniz.
"Dönüşü ticaret yapın, ya da bölgeye geri çekilmeyi bekleyin, ya da her kurulumu risk çizgileri ile çerçeveleyin — ticaret tarzınıza uyan yaklaşımı seçin. Piyasa bağlamını anlayın ve RSI veya MACD gibi diğer araçlarla birleştirin, uyumsuzlukları tespit edin. Bu kombinasyon onun değerini sağlar."
9. Nasıl değerlendirilir
Pratik kontroller: geçmişte geriye kaydırın ve trend çizgisinin sizi sürdürülebilir hareketlerin doğru tarafında tutup tutmadığını ve dönüşlerin nerede kümelendiğini görün; iki ayarı yan yana karşılaştırın (örneğin farklı ATR çarpanı veya trend geriye bakışı) yanıt verme-hazımlılık takasını görmek için; SL/TP çerçevelerini tarihsel olarak gözden geçirin, seçtiğiniz mesafelerde hedefin durdurmadan önce ne sıklıkla ulaşıldığını değerlendirmek için; bir piyasaya uyarlayın (açıkça trend olan vs. sıkı aralıkta); ve saatin farkında olun — piyasa gerçekten hareket ederken en iyi rejimlerini belirler, bu yüzden aktif saatleri sessiz, düşük yoğunluklu dönemlerle karşılaştırın.
"Geçmişi kaydırarak ve ayarları karşılaştırarak değerlendirin — dönüşler ne kadar temiz, giriş bölgesi geri çekilmeleri ne kadar iyi zamanlıyor ve SL/TP çerçeveleri nasıl sonuçlanıyor?"
10. Sınırlamalar ve diğer notlar
Hyper Trend genel, yeniden paketlenmiş göstergelerin kalitesinin üstünde olacak şekilde inşa edilmiştir — ancak bir araçtır, kristal küre değil:
-
- Hala yanlış sinyaller üretebilir. Her sinyale mekanik olarak hareket etmek kendi başına olumlu sonuçlar doğurmaz.
- Beceri ve bağlamı ödüllendirir. Fiyat okumayı temel düzeyde yapabilme ve çevresel piyasa hissi varsayar. Bu bağlam ve sağlam para yönetimi ile birleştiğinde gerçekten güçlü bir araç olur — ve bu kombinasyon uzun vadede olumlu sonuçlar üretir.
- Piyasa hareket ettiğinde en iyisidir. Sessiz dönemlerde veya tamamen normal ticaret saatleri dışında alınan okumalar bu kalitenin bir kısmını kaybeder.
- Trend araçları gecikir ve yanılabilir. Herhangi bir SuperTrend tarzı yaklaşım gibi, dönüşler geç olabilir ve aralıklarda kümelenebilir; yumuşatma ve ATR bandı bunu azaltır ama ortadan kaldırmaz.
- SL/TP çizgileri planlama yardımcısıdır, garanti değildir. Sinyal çubuğunun orta noktasından sabit pip referanslarıdır; spread, kayma veya gerçek dolumunuzu hesaba katmaz ve takip etmezler.
"Temel fiyat okuma, piyasa bağlamı ve para yönetimi getirin, ve uzun vadede gerçekten güçlü olur — piyasa hareket ettiğinde en güçlü."
HyperTrend temiz, müdahale etmeyen bir üst gösterge olarak sunulur; yerleşik giriş zamanlaması, net sinyaller, grafik üzerinde risk çerçevesi ve canlı kontrol paneli içerir. Kullanımı basit, cTrader üzerinde hafif ve herhangi bir tüccar, herhangi bir sembol veya zaman dilimi için tasarlanmıştır.
"Kurulumu kolay, çalıştırması hafif ve herhangi bir tüccarın trendi okumasına, giriş ve çıkışları göstermesine ve riski çerçevelemesine yardımcı olmak için tasarlanmıştır — temiz ve okunabilir tutulur."
Özet
Under the hood, HyperTrend processes price data through selectable sources and optional smoothing filters such as Heikin-Ashi and Kalman filters. It applies volatility bands based on ATR and SuperTrend logic to determine active trend direction. The indicator offers three types of signals—trend switches, entry zone crosses, and trailing line crosses—with labeled markers and optional alerts via sound and popups.
Risk management is supported through on-chart stop-loss and take-profit levels displayed as horizontal lines at fixed pip distances from entry points, helping traders visualize risk/reward before committing. An interactive on-chart panel allows live adjustment of visual settings and parameters without reopening menus.
HyperTrend is optimized for fast, low-CPU performance on cTrader, suitable for all trader experience levels, and applicable across symbols and timeframes. It emphasizes readability and simplicity while incorporating modern data processing techniques to enhance traditional trend-following methods.


