
Descrizione
TIB — Indicatore Tick Imbalance Bars. Rileva le Informazioni di Mercato Prima che il Prezzo si Muova
Versione 2.0
Usa la sezione Commenti per chiedere maggiori dettagli
Disponibile per sessione video con guida all’installazione dopo l’acquisto
Tick Imbalance Bars porta l’analisi della microstruttura di mercato di livello istituzionale su cTrader. Basato sulla ricerca rivoluzionaria di Marcos López de Prado, come dettagliato nel suo libro Advances in Financial Machine Learning, questo indicatore campiona i dati di prezzo non in base al tempo o al volume, ma all’arrivo delle informazioni.
L’Intuizione Fondamentale
Le barre tradizionali (tempo, tick, volume) campionano i mercati in modo uniforme, perdendo momenti critici in cui agiscono trader informati. Tick Imbalance Bars risolve questo problema rilevando quando la pressione di acquisto o vendita supera i livelli attesi — segnalando la presenza di trader informati e un potenziale movimento del prezzo prima che il mercato raggiunga l’equilibrio.
Come Funziona
L’indicatore applica la regola del tick per classificare ogni trade come pressione di acquisto (+1) o vendita (-1). Quindi accumula questi tick firmati fino a quando lo squilibrio cumulativo (θT) supera una soglia dinamica calcolata usando una Media Mobile Ponderata Esponenzialmente (EWMA). Questa soglia attesa si adatta alle condizioni di mercato analizzando la probabilità storica di tick di acquisto rispetto a quelli di vendita. Quando la soglia viene superata, viene creata una nuova barra TIB — ogni barra contiene quantità approssimativamente uguali di informazioni di mercato, indipendentemente dal volume o dal tempo trascorso.
Caratteristiche Principali
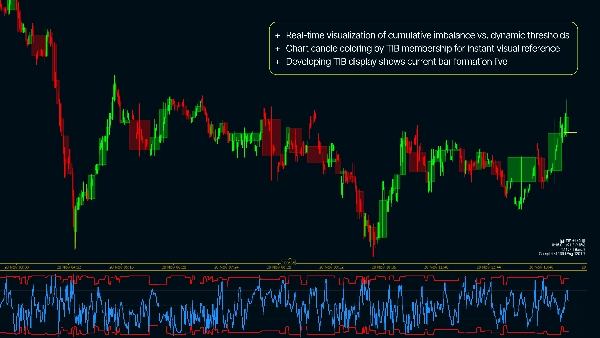
- Visualizzazione in tempo reale dello squilibrio cumulativo rispetto alle soglie dinamiche
- Colorazione delle candele del grafico per appartenenza TIB per un riferimento visivo immediato
- Visualizzazione TIB in sviluppo mostra la formazione della barra corrente in tempo reale
- Filtro Min Ticks per mostrare solo barre statisticamente significative
- Parametri completamente configurabili per la Dimensione Attesa della Barra e EWMA
- Metriche della dashboard che tracciano l’intensità dello squilibrio e la densità informativa
Perché Usare Tick Imbalance Bars?
- Campiona più frequentemente durante periodi ad alta informazione — catturando volatilità azionabile
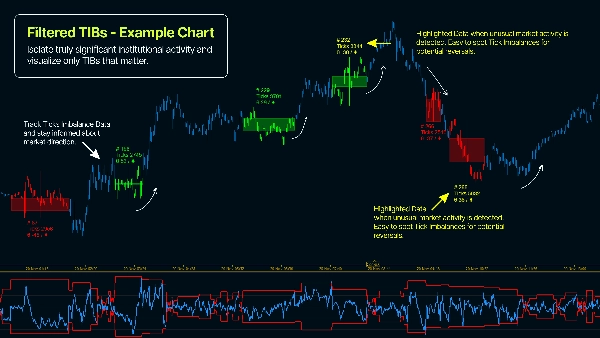
- Rileva l’attività di trading informato prima che venga raggiunto l’equilibrio del prezzo
- Riduce il rumore da partecipanti al mercato non informati e flussi di ordini retail
- Ottiene migliori proprietà statistiche (rendimenti IID simili a Gaussiani) rispetto al campionamento basato sul tempo
- Applica una metodologia di finanza quantitativa comprovata usata dai trader istituzionali
- Identifica informazioni asimmetriche nel flusso di ordini — un predittore comprovato della direzione del prezzo
Guida Pratica alla Configurazione Base ( ! )
- Applica l’indicatore su timeframe da 1 minuto (o inferiore - usa grafici basati sui tick)
- E[T] - Inserisci i Tick Attesi per barra per il campionamento (inizia con 1000)
- EWMA Alpha - [0,001 - 0,5], dove 0,001 produrrà risultati più stabili (in teoria) mentre 0,5 produrrà TIB basati su dati più recenti
- Squilibrio Iniziale - consigliato 0,5 ma puoi sperimentare (0,5 = squilibrio neutro all’inizializzazione)
Riepilogo
The indicator classifies each trade as buying (+1) or selling (-1) pressure using the tick rule and accumulates these signed ticks until a dynamic threshold—calculated via an Exponentially Weighted Moving Average (EWMA)—is exceeded. When this threshold is breached, a new Tick Imbalance Bar (TIB) is formed, each containing roughly equal market information regardless of elapsed time or volume.
Key features include real-time visualization of cumulative imbalance versus dynamic thresholds, candle coloring by TIB membership, live display of the developing bar, a minimum ticks filter for statistical significance, configurable expected bar size and EWMA parameters, and dashboard metrics tracking imbalance intensity and information density.
This approach enables more frequent sampling during high-information periods, reduces noise from uninformed trades, and provides better statistical properties than time-based sampling. It supports markets including Forex, indices, and cryptocurrencies, and is suitable for strategies such as scalping and breakout trading.
Recensioni dei clienti
5 | 100 % | |
4 | 0 % | |
3 | 0 % | |
2 | 0 % | |
1 | 0 % |


