
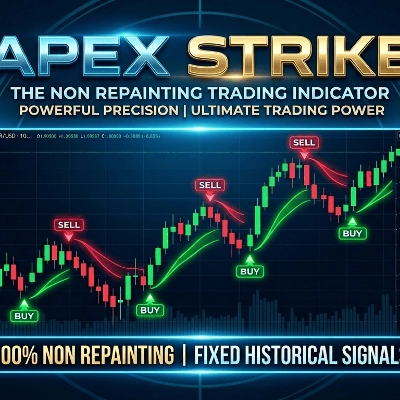
Açıklama
HAI Quantum V10, özellikle volatil piyasalarda etkili olan finansal varlıkların teknik analizi için tasarlanmış gelişmiş bir göstergedir. Mimarisi, algoritmik zekayı fiyat davranışı kalıplarıyla birleştirerek, yatırımcıların giriş ve çıkışlar için yüksek olasılıklı bölgeleri belirlemesini sağlar.
🔥 Piyasaya Dönüş Özel Teklifi – Sınırlı Süre!
Tatil bitti ve işe geri dönme zamanı. Piyasalar uyanırken, stratejiniz de uyanmalı.
Eyleme dönüşü kutlamak için, en güçlü ticaret aracımı — HAI Quantum V10 — sadece 49$'a sunuyorum.
Bu, sezonu güçlü başlatmak isteyen ciddi yatırımcılar için tasarlanmış sınırlı süreli bir teklif. İster avantajınızı geliştirin ister güvenilir bir sistem arayın, bu, kanıtlanmış bir göstergiyi özel bir fiyata alma şansınızdır.
✅ Altın (XAUUSD) için tasarlandı ✅ Birden çok zaman diliminde test edildi ✅ Bir yatırımcı tarafından, yatırımcılar için tasarlandı
Beklemeyin — bu teklif uzun sürmeyecek. Güven ve hassasiyetle oyuna geri dönün.
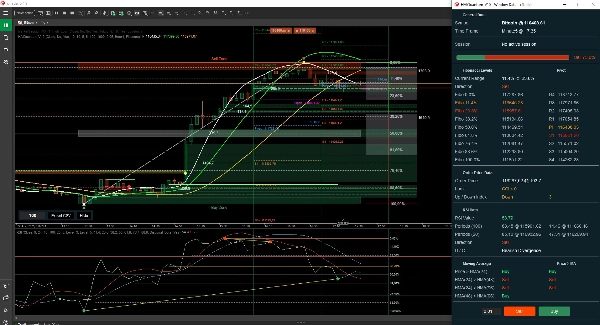
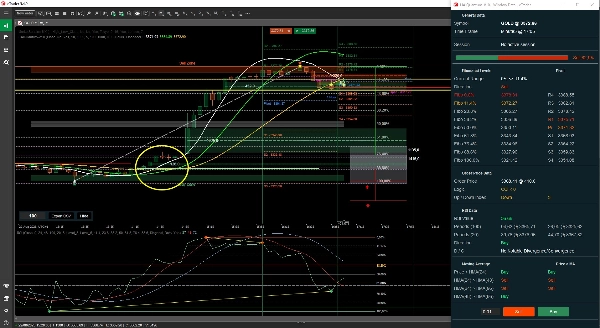
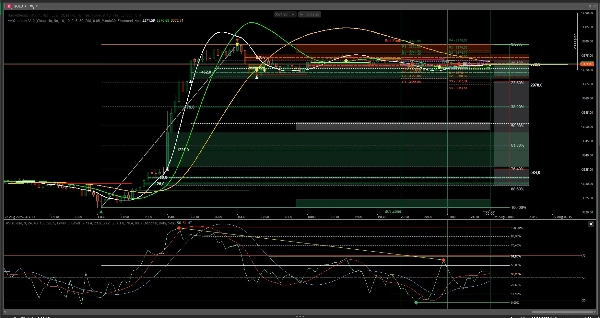
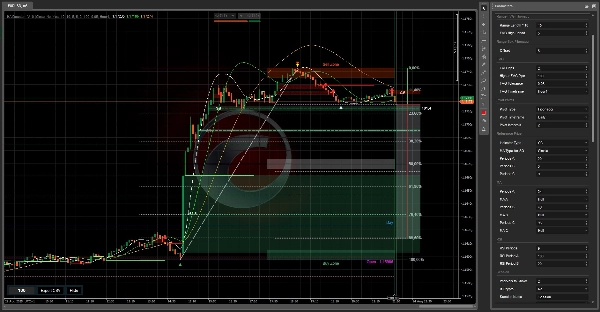
Ürünümüz, size kapsamlı bir piyasa perspektifi sunmak için bir dizi ana göstergeyi entegre eder:
- Range Box Fibonacci (kendi tasarımımız): Fibonacci seviyelerine dayalı potansiyel destek ve direnç bölgelerini belirlemenize yardımcı olan benzersiz bir araç.
- Ana Referans Fiyatları: Üç özelleştirilebilir göstergenin (CCI, Stokastik, RSI) birleşiminden kritik fiyat noktalarını belirliyoruz. Bu noktalar, giriş ve çıkış fırsatlarını tanımlamanızda size rehberlik edecektir.
- Üç Yapılandırılabilir Hareketli Ortalama: Trendleri onaylamak ve fiyat yönündeki değişiklikleri tespit etmek için stratejinize en uygun hareketli ortalamaları seçin.
- RSI: Daha doğru fiyat hareketi tahminleri için. Seçilen dönemler için yüksek ve düşük değerlerle. Görselleştirmeye dahil edilmemiştir.
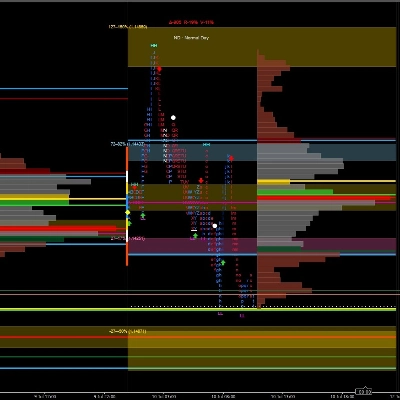
HAI Quantum bu göstergelerden veri toplar ve işler, size iki görselleştirme yöntemi sunar:
- Manuel Mod: Her gösterge yapılandırmasına göre fiyatın yukarı mı yoksa aşağı mı yöneldiğini özetleyen net ve özlü bir pencere.
- Vurgulanmış Fibonacci ve Pivot seviyeleri ile yeni veri penceresi: Bu yeni versiyonda, boyutuna ve Fibonacci veya Pivot seviyesine yakınlığına göre filtrelenebilen FVG (Fair Value Gap)'yi, ayrıca görüntüde gösterildiği gibi azaltma noktalarıyla birlikte entegre ettik.
Özet
Müşteri değerlendirmeleri
5 | 100 % | |
4 | 0 % | |
3 | 0 % | |
2 | 0 % | |
1 | 0 % |


!["Wyckoff Toolkit [Iridio Capital]" logosu](https://cdn.ctrader.com/image/webp/8acfe6a1-6a8e-4578-9367-9df3af2b1801_27763)


