
Açıklama
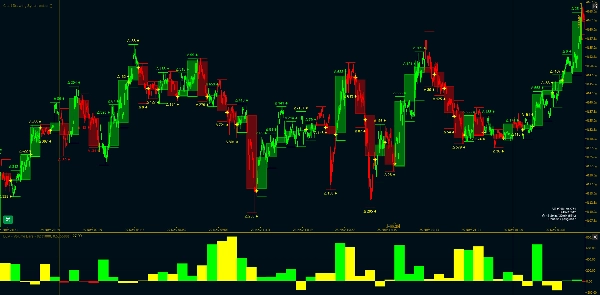
Tick Hacim Çubukları uyarlanabilir bir eşik değerine ulaşan kümülatif hacme dayalı çubuklar oluşturan bilgi odaklı bir çubuk örnekleme yöntemidir. Zaman bazlı çubukların aksine, Hacim Çubukları gerçek zamanlı akış dengesizliği ölçümleri kullanarak piyasa aktivite seviyelerine uyum sağlar.
En İyi: Toplam katılım ve hacim dağılımını önemseyen traderlar.
Temel Ölçüt: Tick Hacmi (V) - Toplam piyasa aktivitesi
Sürüm 1.0
Daha fazla detay için Yorumlar Bölümünü kullanın
Satın alma sonrası Kurulum Kılavuzlu Video Oturumu mevcuttur
----------------------------------------------------------------------------------------------------------------------------------------
Temel Kavram
----------------------------------------------------------------------------------------------------------------------------------------
Geleneksel Zaman Bazlı Çubuklar: Sabit aralıklar (1 dk, 5 dk, vb.)
- Sorun: Piyasa aktivitesi büyük ölçüde değişir
- Aynı zaman dilimi 10 tick veya 10.000 tick içerebilir
Hacim Çubukları: Hacme dayalı değişken aralıklar
- Çözüm: Yeterli hacim biriktiğinde çubuk tamamlanır
- Piyasa aktivitesine uyum sağlar EWMA eşiği kullanarak
----------------------------------------------------------------------------------------------------------------------------------------
Matematiksel Çerçeve
----------------------------------------------------------------------------------------------------------------------------------------
1. Tick Sınıflandırması (Tick Kuralı) - Her tick fiyat hareketine göre alım veya satım olarak sınıflandırılır.
2. EWMA Alım Oranı - Üssel ağırlıklandırma kullanarak alım ticklerinin oranını takip eder.
3. Uyarlanabilir Eşik Hesaplama - Eşik, baskın akış yönüne göre ayarlanır.
4. Hacim Birikimi - Kümülatif alım ve satım hacimlerini takip eder.
5. Çubuk Tamamlama Koşulu - Kümülatif hacim uyarlanabilir eşiğe ulaştığında çubuk tamamlanır.
6. Delta Hesaplama - Delta, emir akışı dengesizliğini ölçer.
----------------------------------------------------------------------------------------------------------------------------------------
Parametre Referansı
----------------------------------------------------------------------------------------------------------------------------------------
Temel Ayarlar
- Beklenen Çubuk Boyutu E[T]: Çubuk başına hedef hacim
- EWMA Alfa: Düzleştirme faktörü
Yedek Mod
- Yedek Zaman Bazlı Kullan: Zaman bazlı çubukları etkinleştir (sabit zaman aralıklarına göre Hacim verisi örneklemesini etkinleştir)
- Yedek Dakikalar: Veri örneklemesi için özel zaman aralığı
Günlük Sıfırlama
- Günlük Sıfırlama: Her yeni gün / oturum için Hacim Örnekleme Hesaplamalarının sıfırlanmasını etkinleştir
- Sıfırlama Saati: Sıfırlama saati
- Sıfırlama Dakikası: Sıfırlama dakikası
- GMT Ofseti: Saat dilimi ofseti
Hacim Filtresi
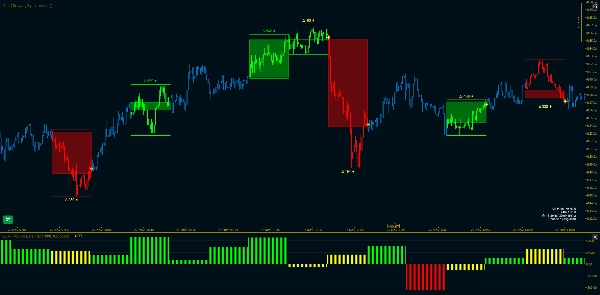
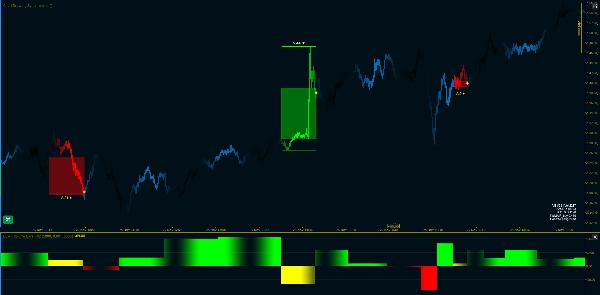
- Hacim Filtresini Etkinleştir: Filtrelemeyi aç/kapat - gösterge sadece Filtrelenmiş Hacim Çubuklarını gösterir
- Min Hacim: Minimum hacim eşiği
Görsel Ayarlar
- Hacim Çubuğu Etiketlerini Göster: Etiketleri aç/kapat
- Diverjans İşaretçilerini Göster: Diverjans işaretçilerini aç/kapat
- Grafik Mumlarını Renklendir: Grafik renklendirmeyi aç/kapat
- Çubuk Şeffaflığı: Hacim Çubukları OHLC şeffaflığı
- Boğa/Ayı Renkleri: Hacim Çubukları Renkleri
----------------------------------------------------------------------------------------------------------------------------------------
Referanslar
----------------------------------------------------------------------------------------------------------------------------------------
- López de Prado, M. - Finansal Makine Öğrenmesinde İlerlemeler
- "Bilgi Odaklı Çubuklar" Bölümü
Özet
Key features include:
- Adaptive bar intervals based on volume rather than fixed time periods
- EWMA smoothing for threshold adjustment reflecting dominant market flow
- Optional fallback to time-based bars with customizable intervals
- Daily reset of volume sampling calculations with configurable reset time and timezone offset
- Volume filtering to display bars exceeding a minimum volume threshold
- Visual customization options such as volume bar labels, divergence markers, candle coloring, transparency, and color schemes for bullish/bearish bars
The indicator is designed for traders focused on total market participation and volume distribution across Forex, commodities, indices, and cryptocurrencies. It incorporates concepts from financial machine learning literature on information-driven bars.
Müşteri değerlendirmeleri
5 | 100 % | |
4 | 0 % | |
3 | 0 % | |
2 | 0 % | |
1 | 0 % |


