Deskripsi
Indikator scalping kompak untuk cTrader yang menggabungkan tiga hal dalam satu overlay bersih: VWAP harian berbasis sesi, panduan Opening Range, gelembung “delta/kekuatan” sebagai penanda momentum/aktivitas, dan zona pasokan/permintaan dinamis dengan status uji/konfirmasi plus filter tren opsional. Di atas itu, termasuk lampu lalu lintas multi-timeframe yang menunjukkan, sekilas, arah candle yang baru saja ditutup di beberapa timeframe (VWAP + Opening Range).
Catatan: Parameter dirancang dengan sengaja agar Anda dapat dengan cepat menyesuaikan alat ini dengan pasar/timeframe Anda; logika berjalan otomatis di latar belakang.
Apa yang Anda dapatkan (fitur)
- VWAP Harian (direset setiap hari perdagangan): Memvisualisasikan “harga sesi” yang adil dan membantu dengan mean reversion, pullback, dan bias arah
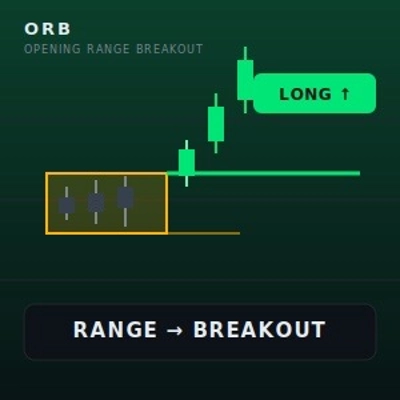
- Opening Range (OR) tinggi/rendah: Menggambar opening range sehingga Anda dapat menyusun setup breakout/reversal (menit otomatis atau manual)
- Gelembung Delta/Kekuatan: Menyoroti candle dengan aktivitas di atas rata-rata (tergantung mode: lonjakan volume, volume range/body, atau proxy delta) dan mewarnainya berdasarkan arah (bullish/bearish)
- Zona Pasokan/Permintaan (dua set pivot A/B): Zona otomatis dari pivot tinggi/rendah yang dikonfirmasi, dengan kedalaman zona berbasis ATR, ekstensi sisi kanan yang ditentukan, dan garis tengah opsional
- Status zona: “Segar → Teruji → Dikonfirmasi” (konfirmasi opsional melalui kondisi volume) sehingga Anda dapat langsung melihat apakah zona sudah diperdagangkan dan apakah bereaksi dengan kekuatan
- Filter tren (opsional): Filter EMA atau EMA+ADX sehingga zona hanya ditampilkan/dipertimbangkan dalam arah tren (misalnya, zona permintaan hanya dalam tren naik)
- Lampu lalu lintas Multi-TF: Menampilkan M1/M5/H1/D1 sebagai hijau/merah/abu-abu tergantung candle terakhir yang ditutup—konteks berguna tanpa mengganti timeframe grafik
Apa yang dapat dikonfigurasi pembeli (ikhtisar parameter)
Pengaturan dikelompokkan dan sengaja praktis:
Inti
- Panjang ATR: Input dasar untuk kedalaman zona dan beberapa metrik gelembung
- Tampilkan VWAP Harian: On/Off
- Tampilkan Opening Range: On/Off
- Mode OR: Otomatis (bergantung pada TF grafik) atau Manual (menit tetap)
- Faktor auto OR / menit OR: Menyesuaikan durasi OR
Filter Tren
- Mode: Mati / EMA / EMA+ADX
- EMA cepat / EMA lambat: Arah tren melalui persilangan/relasi EMA
- Panjang ADX + ambang: Kekuatan tren minimum saat EMA+ADX diaktifkan
- Gambarkan garis EMA: Opsional menampilkan EMA filter di grafik
Gelembung
- Tampilkan gelembung: On/Off
- Proxy delta: Tiga varian (berbobot range, close vs prev, close vs open) tergantung instrumen/feed
- Metrik gelembung: Otomatis atau metrik tetap (abs-delta, lonjakan volume, volume body/range)
- Lookback kuantil + % kuantil: Mengontrol seberapa “jarang” sinyal gelembung (persentase lebih tinggi = hanya kejadian lebih kuat)
- Batas label: Berapa banyak label gelembung yang tetap di grafik (kinerja/kejelasan)
- Font dasar + mode 4K: Skala visual untuk tampilan resolusi tinggi
- Glyph kecil/besar: Bentuk gelembung (titik/lingkaran, dll.)
- Debug: Paksa gelembung (hanya untuk pengujian)
Zona
- Tampilkan zona: On/Off
- Kedalaman zona × ATR: Ketebalan zona (adaptif volatilitas)
- Perpanjang (bar): Sejauh mana zona diperpanjang ke kanan
- Tampilkan garis tengah: On/Off
- Zona hanya dalam tren: Tampilkan zona hanya saat arah filter tren cocok
- Parameter pivot A & B (kiri/kanan): Dua sensitivitas (misalnya, zona “kasar” + “halus”)
- Ukuran label zona: Kecil/Sedang/Besar
- Warna (ARGB): Warna terpisah untuk pasokan/permintaan, teruji, dikonfirmasi + garis tengah
- Konfirmasi dengan volume + vol-MA/pengali: Konfirmasi hanya jika volume tick di atas MA × faktor
Lampu Lalu Lintas
- Tampilkan lampu lalu lintas: On/Off
- Font + skala 4K: Ukuran/keterbacaan
- Perbarui setiap N bar: Frekuensi pembaruan (kinerja vs responsivitas)
(Deskripsi bidang parameter dapat disajikan dengan rapi melalui atribut/deskripsi Parameter; platform mendukung pengelompokan dan deskripsi langsung di UI parameter.)
Untuk siapa ini
- Scalper dan trader intraday yang membutuhkan konteks cepat: VWAP/OR untuk struktur, gelembung untuk “aktivitas,” zona untuk area reaksi
- Trader yang menginginkan visualisasi jelas tanpa menumpuk banyak indikator
- Pengguna yang mungkin menginginkan tampilan filter tren opsional (EMA/ADX), sambil menjaga inti sebagai tampilan plug-and-play
Penggunaan tipikal (singkat & praktis)
Periksa bias melalui VWAP + lampu lalu lintas, dan gunakan OR sebagai “zona pertempuran” selama fase pembukaan.
Gunakan gelembung sebagai petunjuk bahwa “ada sesuatu di atas rata-rata yang terjadi di sini” (breakout, absorpsi, impuls).
Gunakan zona sebagai area perencanaan: sentuhan pertama = “Teruji”; reaksi dengan volume tinggi dapat ditandai sebagai “Dikonfirmasi”; garis tengah membantu perdagangan level-ke-level yang bersih.