คำอธิบาย
ตัวชี้วัด Kalman Filter สำหรับ cTrader 5.5+ มอบมุมมองแนวโน้มตลาดที่ชัดเจนและปรับตัวได้โดยตอบสนองอย่างไดนามิกต่อสภาวะราคาที่เปลี่ยนแปลง
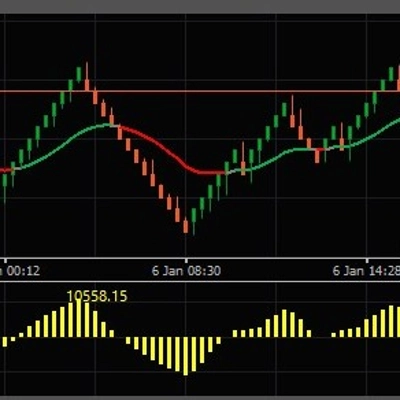
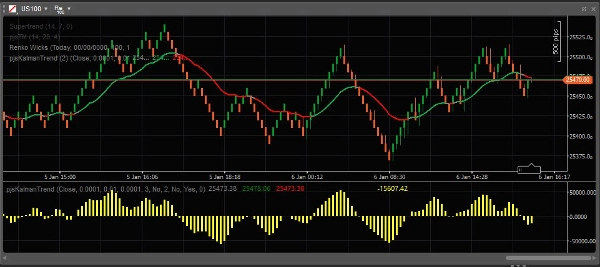
สร้างขึ้นบน อัลกอริทึม Kalman ที่ปรับตัวเองได้ ตัวชี้วัดจะแสดงเส้นกรองแนวโน้มที่เรียบเนียนซึ่งลดเสียงรบกวนโดยไม่ทำให้เกิดความล่าช้ามากเกินไป เมื่อพลวัตของตลาดเปลี่ยนแปลง ตัวกรองจะปรับตัวโดยอัตโนมัติ—ทำให้เหมาะสำหรับทั้งช่วงแนวโน้มและช่วงเปลี่ยนผ่าน
คุณสมบัติหลักรวมถึง การเปลี่ยนสีตามแนวโน้ม เพื่อการตอบสนองทางสายตาทันที, ฮิสโตแกรมที่เป็นทางเลือก สำหรับการประเมินโมเมนตัมและอคติ และความสามารถในการ แสดงผลบนแผนภูมิหลักหรือในหน้าต่างแยกต่างหาก เพื่อให้เหมาะกับกระบวนการทำงานและกลยุทธ์ที่แตกต่างกัน
ออกแบบมาเพื่อการใช้งานในการเทรดที่ใช้งานได้จริง ตัวชี้วัดมีน้ำหนักเบา มีประสิทธิภาพ (คำนวณเมื่อแท่งปิด) ปรับแต่งได้ และปราศจาก หน้าจอรบกวนหรือการขัดจังหวะ—ช่วยให้คุณมุ่งเน้นไปที่การดำเนินการและการวิเคราะห์อย่างเต็มที่
คุณสมบัติ
- ตัวกรองแนวโน้ม Kalman ที่ปรับตัวเองได้
- การแสดงแนวโน้มที่เรียบเนียนและมีเสียงรบกวนต่ำ
- การเปลี่ยนสีอัตโนมัติตามทิศทางแนวโน้ม
- การแสดงฮิสโตแกรมที่เป็นทางเลือก
- การแสดงผลบนแผนภูมิหรือหน้าต่างแยกต่างหาก
- เข้ากันได้กับ cTrader 5.5+
- ไม่มีหน้าจอรบกวน
ตัวชี้วัดนี้เหมาะสำหรับเทรดเดอร์ที่ต้องการ ตัวกรองแนวโน้มที่สะอาดและปรับตัวได้ ซึ่งผสานรวมได้อย่างราบรื่นกับวิธีการแบบดุลยพินิจหรือแบบเป็นระบบ
สรุป
รีวิวจากลูกค้า
5 | 50 % | |
4 | 50 % | |
3 | 0 % | |
2 | 0 % | |
1 | 0 % |


