
Açıklama
Pinescriptlabs Store göstergeleri: 🤖Pinescriptlabs Store cBots:
SmartTrend Destek &
Direnç Çizgileri Altın & BTC KırılmaOturum Pivotları(yeni)YieldShield" 🛡️
Dinamik Piyasa Yapısı
Dönüş Noktalarının Analizi
Fibonacci Lineer
Regresyon Çok Zaman Dilimli
Çok Seviyeli Mum Eğilimi
Takipçisi
Otomatik Destek ve
Direnç Trend Çizgileri
Tüm Destek ve
Direnç Seviyeleri
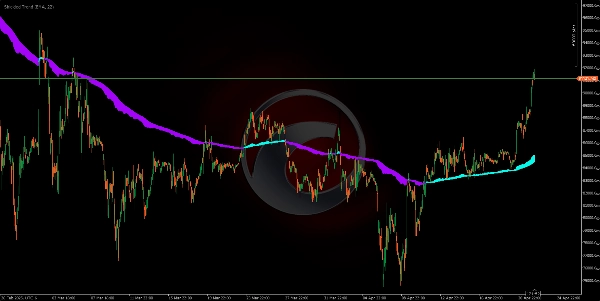
ShieldedTrend göstergesi, iki yaygın kullanılan ticaret metodolojisinin akıllı bir kombinasyonuna dayanır: Heikin-Ashi mumları 📊 ve üstel hareketli ortalamalar (EMA) 📈. İşte adım adım mantığı:
1️⃣ Temel: Değiştirilmiş Heikin-Ashi Mumları
Heikin-Ashi mumları, piyasa gürültüsünü filtrelemek için tasarlanmış geleneksel mumların yumuşatılmış bir versiyonudur. Orijinal hesaplamaları fiyat ortalamalarını kullanır, ancak ShieldedTrend onları iki önemli şekilde değiştirir:
- Heikin-Ashi Kapanışı:
Gerçek mumun 4 ana fiyatının ortalaması olarak hesaplanır:
(Açılış + Yüksek + Düşük + Kapanış) / 4 🔄. - Heikin-Ashi Açılışı:
Gerçek fiyattan doğrudan alınmaz, bunun yerine önceki Heikin-Ashi mumunun açılış ve kapanış ortalamasıdır.
Bu, keskin dalgalanmaları ortadan kaldıran ve trendleri daha net hale getiren doğal bir "yumuşatma" etkisi oluşturur.
2️⃣ EMA ile Yumuşatma
ShieldedTrend, Heikin-Ashi mumlarının her iki bileşenine de üstel hareketli ortalama (EMA) uygular:
- Yumuşatılmış Açılış Çizgisi:
Heikin-Ashi açılışına uygulanan EMA. - Yumuşatılmış Kapanış Çizgisi:
Heikin-Ashi kapanışına uygulanan EMA.
EMA, son verilere daha fazla ağırlık vererek göstergenin trend değişikliklerine hızlı tepki vermesini sağlarken yumuşaklığı korur.
3️⃣ "Koruma Bölgesi" (Kalkan) 🛡️
İki çizgi (yumuşatılmış açılış ve kapanış) arasındaki renkli alan, bir tampon veya onay bölgesi görevini görür:
- Bölge Genişliği:
İki çizgi arasındaki farkın büyüklüğüne bağlıdır. -
- Geniş alan = Güçlü trend (çizgiler birbirinden uzak) 💪.
- Dar alan = Kararsızlık veya zayıf trend 🤔.
4️⃣ Entegre Ticaret Mantığı
- Trend Sinyali:
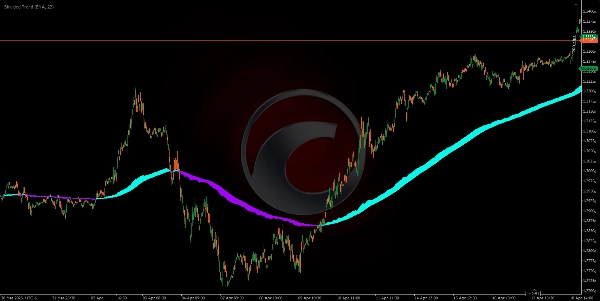
Renk değişimi potansiyel bir dönüşü gösterir (örneğin, camgöbeği'nden mora = olası bir düşüş trendinin başlangıcı) 🔵🟣. - Trend Gücü:
Renkli alanın genişliği bir güven filtresi görevini görür: -
- Alan yeterince genişse işlem yapın (dalgalı piyasaları önler) ✅.
- Yanlış Hareketlere Karşı Koruma:
Alan aniden daralırsa, mevcut trendin momentumunu kaybediyor olabileceğini gösterir—renk henüz değişmemiş olsa bile ⚠.
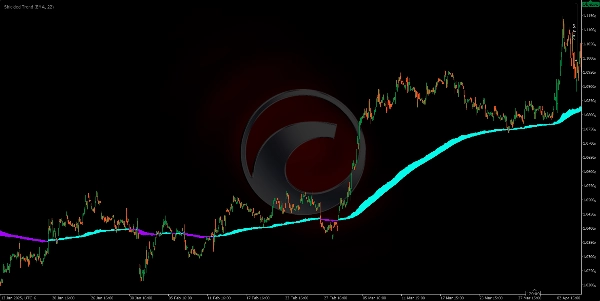
🌟 Neden İşe Yarıyor?
- Heikin-Ashi + EMA: Fiyatı iki kez yumuşatır (mumlar + hareketli ortalama), gürültünün %90'ını filtreler 🎯.
- Koruma Bölgesi: Belirsiz piyasalarda işlem yapmaktan kaçınır, başarısız işlemleri azaltır 📉➡️📈.
- Görsel Yaklaşım: Renk ve alan kombinasyonu, başlangıç seviyesindeki yatırımcıların hızlıca desenleri fark etmesini kolaylaştırır ⚡.
Özet
The indicator applies EMA smoothing to both the Heikin-Ashi open and close lines, enabling quick reaction to trend changes while maintaining smoothness. The area between these two smoothed lines forms a "Protection Zone" or shield, which acts as a buffer and confirmation zone. The width of this zone indicates trend strength: a wide zone signals a strong trend, while a narrow zone suggests indecision or a weak trend.
ShieldedTrend’s integrated trading logic uses color changes to signal potential trend reversals and the zone width as a confidence filter to avoid trading in choppy markets. The indicator helps protect against false moves by signaling when trend momentum is weakening even before a color change occurs. Its visual design facilitates quick pattern recognition, making it accessible for traders of all experience levels.


