Descrizione
📈 Stochastic RSI
L'indicatore Stochastic RSI è un oscillatore di momentum che applica la formula Stochastic ai valori RSI anziché al prezzo, rendendolo un indicatore di seconda derivata. È particolarmente utile per identificare condizioni di ipercomprato e ipervenduto con una sensibilità maggiore rispetto al RSI standard.
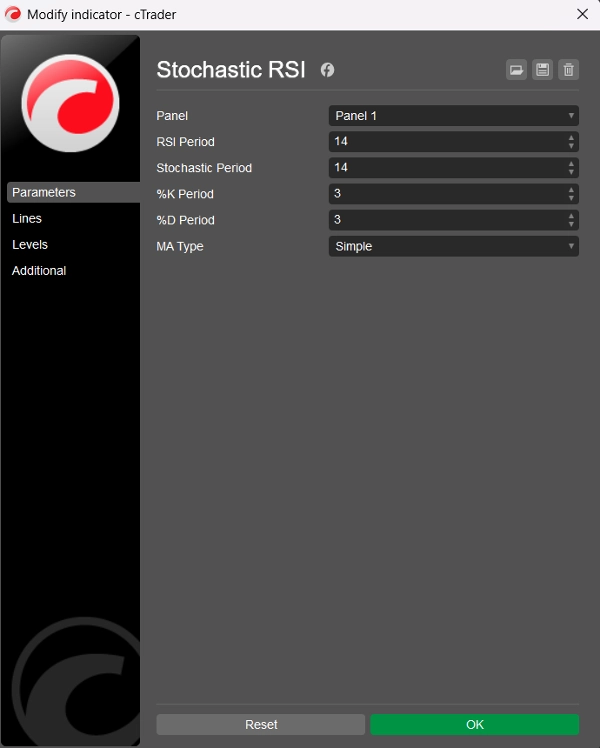
🛠️ Parametri
Periodo RSI: Il periodo di lookback utilizzato per calcolare il RSI base (default = 14)
Periodo Stochastic: Il periodo di lookback applicato ai valori RSI per calcolare lo Stochastic RSI (default = 14)
Periodo %K: Il periodo di smoothing per la linea %K (default = 3)
Periodo %D: Il periodo di smoothing per la linea %D (default = 3)
Tipo MA: Tipo di media mobile per il smoothing: scelta tra 11 tipi (default = Semplice)
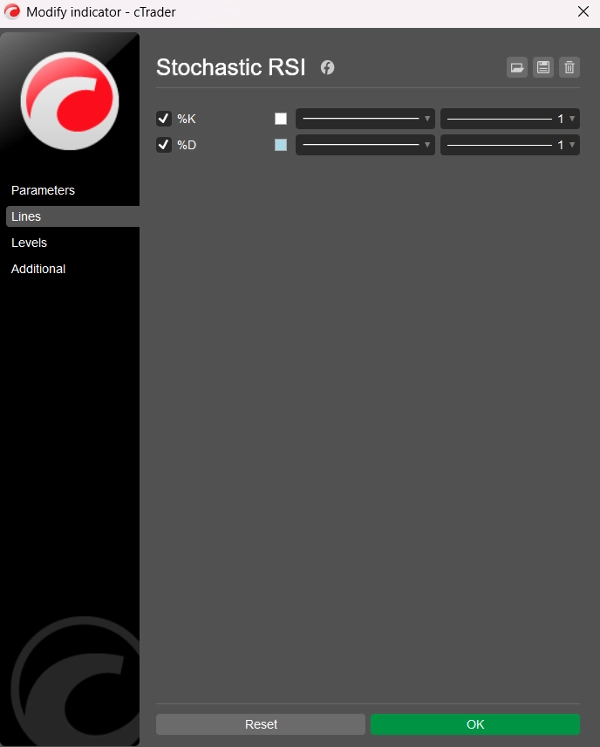
📊 Linee di Output
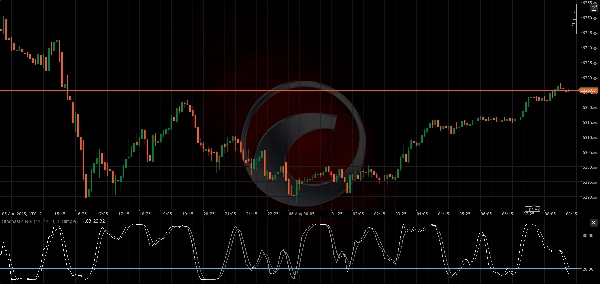
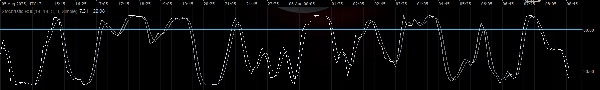
- Linea %K: Stochastic RSI smussato (bianco)
- Linea %D: media mobile smussata di %K (azzurro chiaro)
Entrambe le linee oscillano tra 0 e 100, permettendo letture chiare di ipercomprato e ipervenduto.
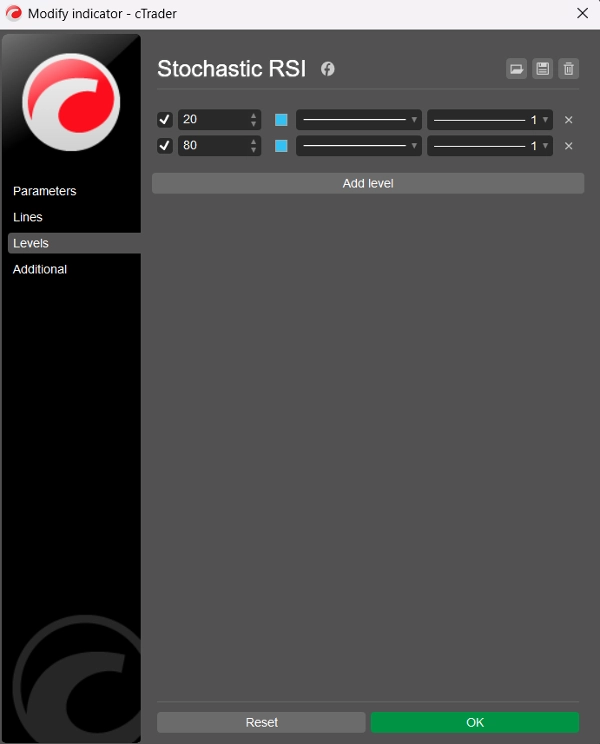
⚠️ Livelli Suggeriti
Sebbene l'indicatore non mostri livelli statici di default, si consiglia agli utenti di aggiungerli manualmente tramite la scheda “Livelli” in cTrader:
- Livello 80 → Ipercomprato
- Livello 20 → Ipervenduto
Questi livelli funzionano in modo simile all'Oscillatore Stocastico tradizionale ma applicati al comportamento del RSI, rendendo i segnali più netti e spesso più rapidi.
🧠 Come Usare
- Ipercomprato (>80): Può indicare che il prezzo è eccessivamente esteso al rialzo — potenziale inversione o consolidamento.
- Ipervenduto (<20): Può segnalare che il prezzo è ipervenduto — possibile rimbalzo o inversione di tendenza.
- Incroci %K e %D: Possono essere usati similmente allo Stochastic o MACD — un incrocio rialzista sotto 20 o un incrocio ribassista sopra 80 può essere operativo.
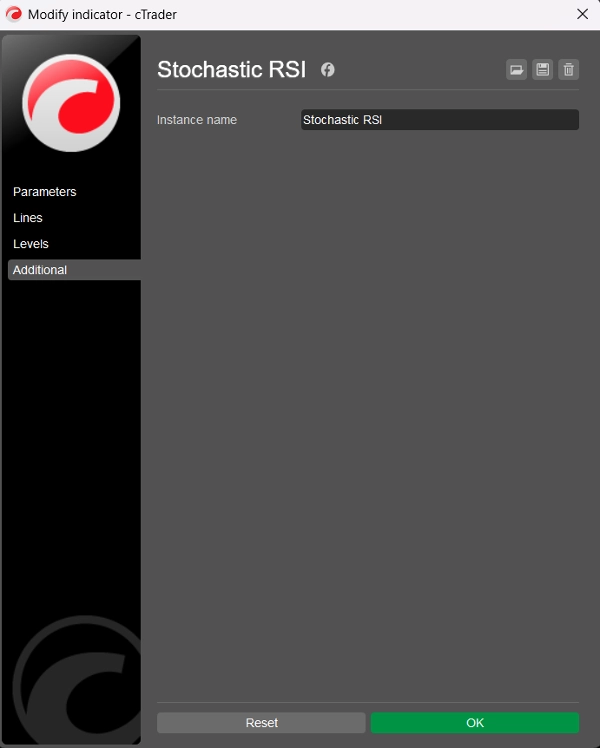
🏷️ Note
- Realizzato per cTrader usando C# e l'API Automate
- Pulito, efficiente e personalizzabile con 11 tipi di MA
- Codice e logica di BlueRocketBots & ChatGPT (OpenAI)
- Codice pulito (totale 99 righe; 54 righe di codice, 27 righe di testo, 18 righe vuote)
- Versione migliorata V2
- Gratis!
Riepilogo
Key parameters include the RSI Period (default 14), Stochastic Period (default 14), %K and %D smoothing periods (default 3 each), and a choice among 11 moving average types for smoothing (default is Simple). The indicator outputs two lines: the %K line (smoothed Stochastic RSI) and the %D line (smoothed moving average of %K), both oscillating between 0 and 100.
Suggested manual levels for interpretation are 80 (overbought) and 20 (oversold). Traders may use these levels along with %K and %D crossovers to identify potential price reversals or consolidations. For example, a bullish crossover below 20 or a bearish crossover above 80 can signal actionable market moves.
The indicator is implemented in clean, efficient C# code using the Automate API, allowing customization and integration within cTrader.


![Logo di "[Stellar Strategies] Visual Trend Momentum"](https://cdn.ctrader.com/image/webp/48aee0a5-f10e-4bc8-9671-78e156fcc5df_27548)