present
Zarejestruj się i otrzymaj 50 $ zniżki na pierwszy zakup
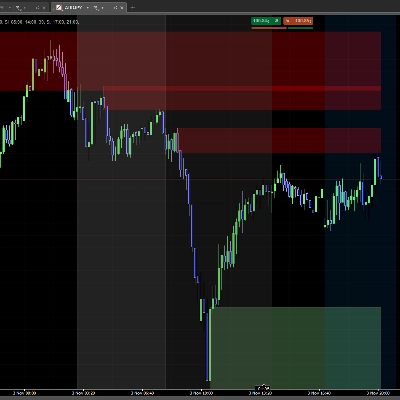
Trading product for Daily Fibo Wskaźnik Forex Indices, image 1
Daily Fibo
Wskaźnik
257 pobrania
Wersja 2.0, Jun 2026
Windows, Mac
4.5
Opinie: 2
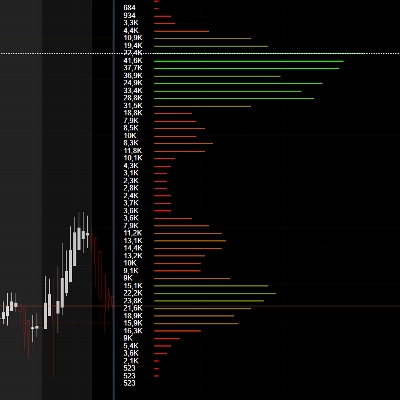
Trading product for Daily Fibo Wskaźnik Forex Indices, image 2
Od 24/02/2025
18
Sprzedaż
2.19K
Bezpłatne instalacje

Opis

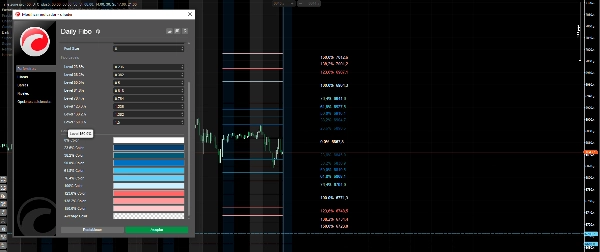
Średnia dzienna Fibonacci - Automatyczne dzienne poziomy Fibonacciego

Projekcja średniego dziennego zakresu w poziomach Fibonacciego od otwarcia dnia

Co robi ten wskaźnik?

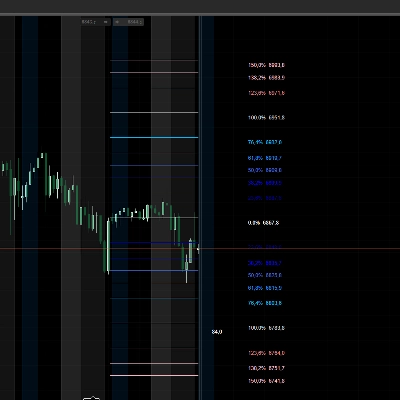
Średnia dzienna Fibonacci automatycznie rysuje poziomy Fibonacciego na podstawie średniego dziennego zakresu. Każdego dnia wskaźnik wyznacza kluczowe poziomy zarówno w górę, jak i w dół od ceny otwarcia, pomagając zidentyfikować potencjalne cele i strefy odwrócenia.

Główne cechy

✅ Automatyczna codzienna aktualizacja - Poziomy są automatycznie rysowane na nowo każdego dnia ✅ Konfigurowalne poziomy - Możliwość ustawienia do 8 różnych poziomów Fibonacciego ✅ Własne kolory - Każdy poziom ma swój rozpoznawalny kolor ✅ Etykiety z cenami - Pokazuje zarówno procent, jak i dokładną cenę każdego poziomu ✅ Regulowana średnia dzienna - Wybierz, ile dni ma być użytych do obliczenia średniej (domyślnie 20)

Domyślnie uwzględnione poziomy

  • 0% - Otwarcie dnia (linia bazowa)
  • 23,6%, 38,2%, 50%, 61,8%, 76,4% - Wewnętrzne cofnięcia i rozszerzenia
  • 100% - Pełny średni zakres
  • 123,6%, 138,2%, 150% - Zewnętrzne rozszerzenia

Jak korzystać ze wskaźnika

  1. Określ kierunek - Cena otwarcia (0%) jest twoim punktem odniesienia
  2. Szukaj celów wzrostowych - Wyższe poziomy oznaczają cele kupna
  3. Szukaj celów spadkowych - Niższe poziomy oznaczają cele sprzedaży
  4. Strefy odwrócenia - Gdy cena osiąga ekstremalne poziomy (100%+), szukaj możliwych odwróceń

Regulowane parametry

  • Liczba dni do obliczenia średniej
  • Własne poziomy Fibonacciego
  • Indywidualne kolory dla każdego poziomu
  • Pokaż/ukryj etykiety i ceny
  • Rozmiar czcionki


Idealny dla traderów poszukujących jasnych celów i prawdopodobnych stref cenowych podczas sesji handlowej.

Podsumowanie

AI summary
Daily Fibo is an indicator that automatically projects Fibonacci levels based on the average daily price range, starting from the day's opening price. It redraws these levels each trading day to help identify potential price targets and reversal zones. The indicator includes up to eight customizable Fibonacci levels, ranging from 0% (day's opening) through common retracements (23.6%, 38.2%, 50%, 61.8%, 76.4%) to full and extended ranges (100%, 123.6%, 138.2%, 150%). Each level can be assigned a distinct color and labeled with both the percentage and exact price for clarity. Users can adjust parameters such as the number of days used to calculate the average range, visibility of labels, and font size. This tool supports markets including Forex, Indices, Crypto, and Stocks. Traders can use Daily Fibo to identify bullish and bearish targets relative to the opening price and to anticipate possible reversal points when prices reach extreme Fibonacci extensions.
Profil wskaźnika

Opinie klientów

4.5
Opinie: 2
5
50 %
4
50 %
3
0 %
2
0 %
1
0 %
Opinie klientów
November 3, 2025
I was looking for this kind of indicator in cTrader, thank you
November 3, 2025
This is great !!!

Dyskusja

Częste pytania

Forex
Indices
Crypto
Stocks
Produkty dostępne za pośrednictwem cTrader Store, w tym boty handlowe, wskaźniki i wtyczki, dostarczane są przez deweloperów zewnętrznych i udostępniane wyłącznie w celach informacyjnych oraz w celu zapewnienia dostępu technicznego. cTrader Store nie jest brokerem i nie zapewnia doradztwa inwestycyjnego, nie udziela spersonalizowanych rekomendacji ani nie gwarantuje przyszłych wyników.

Więcej od tego autora

Wskaźnik
Forex
Crypto
+1
Order block
Wskaźnik
Forex
NAS100
+3
volumen perfile
Wskaźnik
Forex
Crypto
+3
FREE Global Trading Sessions Indicator
Wskaźnik
Forex
Crypto
+2
PREMIUN INDICATOR
Wskaźnik
Forex
Crypto
+1
Super Arrows
Wskaźnik
Forex
Crypto
+5
ICT Order Block Advanced
Wskaźnik
Signal
Bollinger
BB20 MULTICOLOR
Wskaźnik
Forex
Crypto
+3
Perfect Trend
Wtyczka desktopowa
Trade Alerts
Quick Switch Toolbar
Wskaźnik
Forex
Crypto
+2
HTF Candle
Wskaźnik
Supertrend
Moving Average
Easy Trade: Trend & Breakout Indicator for cTrader
Wskaźnik
Forex
Crypto
+3
INSTITUTIONAL Nonlag Candle

Możesz także polubić

Wskaźnik
ATR
RSI
+5
Multi-factor VWAP mean-reversion signals with ATR bands, volume exhaustion, and RSI gate on cTrader.
Wskaźnik
Volume
Custom range volume profile between two draggable anchors. Auto source timeframe, Total/Up-Down/Delta, POC, Value Area.
Wskaźnik
Prop
Forex
+5
Traders Panel: Scan 15 pairs across 5 timeframes. Live heatmap, strength rankings and best setups in one panel.
Wskaźnik
VWAP
Forex
+7
VWAP + Swing Liquidity + SFP Signals — detects liquidity sweeps with color-coded alerts.
Wskaźnik
RSI
Forex
+7
Qualitative Quantitative Estimation
Wskaźnik
Risk Dashboard
AI-powered daily range forecasts help traders spot volatility opportunities and plan stops and targets.
Wskaźnik
AI-assisted
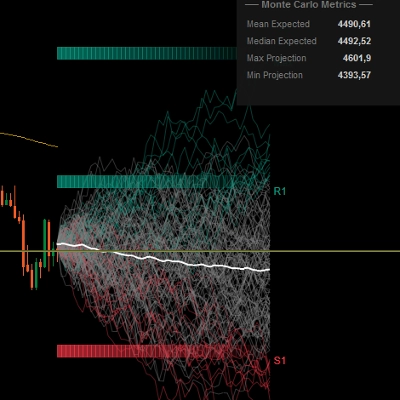
Predictive Monte Carlo Engine Forecast future price paths using institutional-grade statistical models and probability
Wskaźnik
Track VWAP for Asia, London, NY, Sydney, Daily, Weekly, Monthly & Custom Sessions. Perfect for FX & intraday trading!
Wskaźnik
ATR
SMC
+2
HTF POWER 3 ICT Power of 3 · M1 Precision · H4 Intelligence Auto-detect Accumulation → Manipulation → Distribution
Wskaźnik
MACD
Dynamic MACD histogram dots with smart crossing signals for faster momentum analysis.
Wskaźnik
ATR
RSI
+1
Super Trend Rsi ,ATR + trend change distance + dynamic Alpha, divergence/convergence
Wskaźnik
Prop
Forex
+10
IBS Indicator – Measures price position within bars for smarter trades. Works on all markets & timeframes.
Wskaźnik
ADX
ATR
+5
10 Factors. One Signal. Zero Guesswork.
Wskaźnik
ATR
Prop
+13
Enhance trading with ATR Bands! Visualize market volatility using dynamic upper and lower ATR bands for precise decision
Wskaźnik
EMA
Volume
Map range high, mid, low, price location and a deterministic pressure proxy on your cTrader chart.
Logo „QX SmartStructure”
Najwyżej oceniane
4.7
(4)
$26
/
$50
Wskaźnik
AI
ATR
+26
SMC without the mess: Clean structure + auto-managing FVGs + MTF panel. Hard-right-edge, step size-based for any symbol.
Wskaźnik
Captra High TF Plotter visualizes high timeframe Bar on lower timeframe charts, highlighting with bull/bear colors.
Wskaźnik
SMC
VWAP
+5
Most advanced Volume Profile Pivot Box indicator — auto pivots, volume zones, smart candle coloring & SMC trading tool.

Cena

Od 24/02/2025
18
Sprzedaż
2.19K
Bezpłatne instalacje