Descrizione
Indicatori Pinescriptlabs Store: 🤖Pinescriptlabs Store cBots :
ICT Power of 3 (cBot) Gold & BTC BreakoutSession Pivots(nuovo)YieldShield"
SmartTrend Supporto &
Linee di Resistenza
Dynamic Market Structure
Analisi dei Punti di Inversione
Fibonacci Linear
Regressione Multi-timeframe
Multi-Level Candle Bias
Tracker
Auto Supporto e
Linee di Tendenza di Resistenza
Tutti i Supporti e
Livelli di Resistenza
Mappa di Liquidazione della Leva
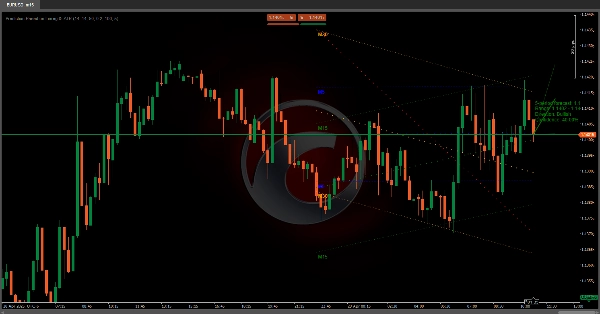
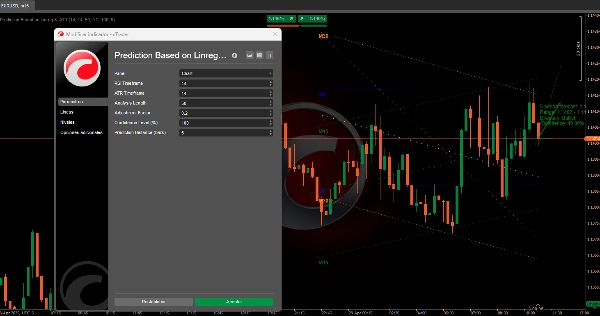
📈 Canale di Regressione Multi-Timeframe & Algoritmo di Predizione ATR
Questo sistema prevede il potenziale movimento di prezzo di un asset combinando analisi di trend multi-timeframe 📊, volatilità di mercato 📉 e conferma tramite indicatori tecnici ✅. Il suo obiettivo è proiettare un intervallo di prezzo futuro con una confidenza misurabile, ideale per identificare opportunità di rischio-rendimento ad alta probabilità 💰.
🔧 Come Funziona Passo per Passo
1️⃣ Analisi del Trend Multi-Timeframe
- Canali di Regressione Attraverso i Timeframe:
L'algoritmo analizza simultaneamente quattro diversi timeframe (dal breve al lungo termine). Per ciascuno: -
- Calcola una linea di tendenza statistica basata sul comportamento storico del prezzo.
- Definisce un canale di previsione intorno a questa linea (usando la volatilità passata per impostare i limiti superiori/inferiori).
- Influenza Gerarchica:
I timeframe più brevi hanno più peso nella direzione finale, riflettendo la loro sensibilità ai movimenti recenti.
2️⃣ Integrazione della Volatilità (ATR) 🌊
- Regolazione Dinamica della Volatilità:
Le previsioni si adattano alle condizioni di mercato attuali: -
- Alta volatilità → Proiezioni più ampie
- Bassa volatilità → Regolazioni conservative
- Scala dell'Intervallo Futuro:
La banda di previsione si adatta automaticamente in base alla volatilità prevista.
3️⃣ Sistema di Conferma del Trend ✅
Combina quattro segnali chiave per convalidare o mettere in discussione la direzione basata sulla regressione:
- Incroci di Medie Mobili (conferma del trend)
- Oscillatori di Momentum (valutazione della forza)
- Indicatori di Volatilità (rilevamento di ipercomprato/ipervenduto)
- Analisi della Divergenza (indizi di inversione del trend)
- Output: Un sistema di punteggio che rafforza o mette in dubbio il trend previsto.
4️⃣ Calcolo della Fiducia 🎯
- Allineamento dei Timeframe:
La fiducia aumenta quando i trend sono concordi tra i timeframe. - Soglia Definita dall'Utente:
I trader possono impostare un livello minimo di fiducia per filtrare solo segnali ad alta certezza.
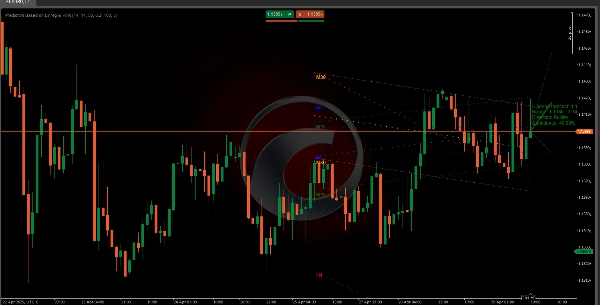
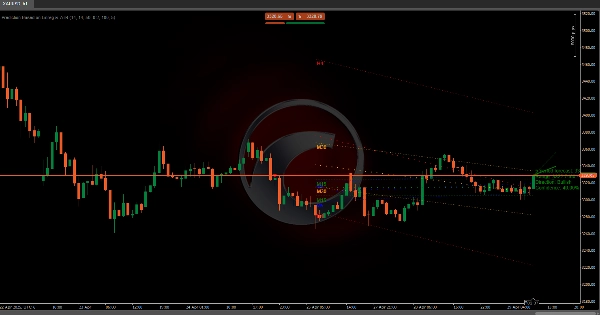
5️⃣ Visualizzazione Intuitiva 📉📈
- Linea di Previsione:
Mostra il percorso centrale previsto (verde = rialzista 🟢, rosso = ribassista 🔴, grigio = neutro ⚪). - Bande di Intervallo:
Evidenziano la zona di movimento del prezzo più probabile, aggiustata per la volatilità. - Etichetta Informativa:
Riassume prezzo previsto, intervallo, direzione e livello di fiducia.
🌟 Vantaggi Chiave
- Approccio Multi-Dimensionale: Combina trend, volatilità e momentum per ridurre i falsi segnali.
- Auto-Regolazione: Si adatta automaticamente a mercati instabili o in trend.
- Metriche Trasparenti: La fiducia quantificabile aiuta a gestire le aspettative.
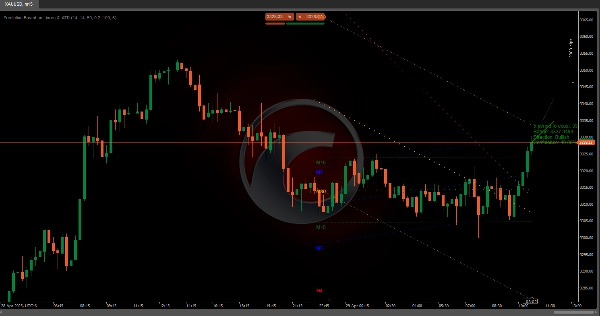
📌 Esempio Pratico
Se il sistema rileva:
- Trend rialzista nei timeframe brevi + conferma del momentum
- Bassa volatilità recente
- Forte accordo tra i timeframe
→ Proietta un aumento di prezzo con una banda stretta e alta fiducia (es. 85%) 🚀
Riepilogo
The ATR component dynamically adjusts the prediction bands to current market conditions, widening during high volatility and narrowing during low volatility periods. A trend confirmation system integrates four key signals—moving average crosses, momentum oscillators, volatility indicators, and divergence analysis—to validate or question the regression-based trend, producing a scoring system that indicates trend strength.
Confidence levels are calculated based on alignment of trends across timeframes, with user-configurable thresholds to filter signals by certainty. Visualization includes a central prediction line (color-coded for bullish, bearish, or neutral trends), range bands highlighting probable price zones, and an info label summarizing projected price, range, direction, and confidence.
The indicator supports markets including cryptocurrencies (e.g., BTCUSD), commodities (e.g., XAUUSD), and others. It aims to identify high-probability risk-reward opportunities by combining trend, volatility, and momentum analysis in a self-adjusting, transparent framework.