Penerangan
🚀 Lebih 10,000 pedagang sudah menggunakan penunjuk TERBAIK kami 🏆
👉 Dapatkan semua sistem TERBAIK kami di sini:
_______________________________________________
📌 Penunjuk Struktur Pasaran
· ✅ AdvancedMarket Structure: Bos, Choch, SwinLevels, Order Blocks, Market Structure& Liquidity Finder
· 🔄 Analisis Struktur Pasaran Dinamik Titik Pusing
· 🧱 Blok Pesanan
· ⚖️ Ketidakseimbangan Pasaran
· ⛓️ BOS & CHOCH
· 🧠 Kuasa ICT 3
_______________________________________________
🔚 Sistem Keluar Pintar
_______________________________________________
📐 Penunjuk ZigZag
· 🔍 Unjuran Likuiditi Harga ZigZag
· ➖ ZigZag
· 🎯 Penjejak Extremiti Zig-Zag
_______________________________________________
🧱 Penunjuk Sokongan & Rintangan
· 🟩 Garis Sokongan & Rintangan SmartTrend
· 🧱 Semua Tahap Sokongan dan Rintangan
_______________________________________________
📊 Penunjuk Trend & Saluran
· 📊 Supertrend
· ⚡Penganalisis Trend Momentum
_______________________________________________
💧 Alat Isipadu & Likuiditi
· 🔍 Jurang Nilai Adil Momentum
_______________________________________________
⚡ Penunjuk Momentum & RSI
· 🔎 Penjejak Bias Lilin Berbilang Tahap
Tracker
_______________________________________________
🔮 Alat Ramalan & Unjuran
· 📐 Ramalan Berdasarkan Linreg& ATR
· 📏 Regresi Linear FibonacciBerbilang jangka masa
· 📈 Pemproyektor Aliran Pasaran Berkuasa Volume
📊 Pengesan Pecahan Pivot
🎯 **Apa itu dan untuk apa?**
https://ctrader.chartshots.net/c/68e935cb9f52a
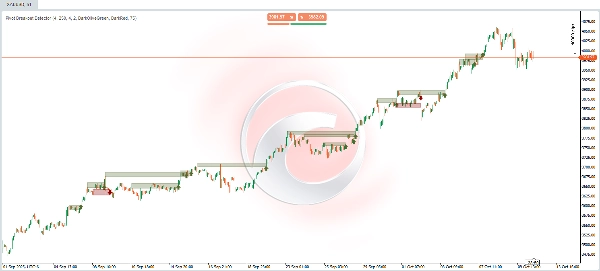
Pengesan Pecahan Pivot adalah penunjuk teknikal lanjutan yang direka untuk secara automatik mengenal pasti pecahan penting dari zon pengumpulan harga. Penunjuk ini menganalisis tingkah laku sejarah pasaran untuk mengesan kawasan di mana harga telah berulang kali "memantul" (mewujudkan rintangan atau sokongan) dan memberi amaran apabila pecahan dengan momentum akhirnya berlaku.
**Kegunaan Utama:**
• Kenal pasti peluang dagangan dalam pecahan yang disahkan
• Elakkan pecahan palsu melalui pengesahan sentuhan berganda
• Visualisasikan zon sokongan dan rintangan dinamik kritikal
• Tangkap pergerakan eksplosif selepas pengumpulan
________________________________________
🔍 **Bagaimana Ia Berfungsi? - Logik Asas**
**Fasa 1: Pengesanan Pivot Penting**
https://ctrader.chartshots.net/c/68e9368eb6e7c
Penunjuk sentiasa mengimbas carta mencari titik pivot - tinggi dan rendah tempatan yang mewakili tempat harga berubah arah. Pivot ini penting kerana menandakan tahap di mana terdapat minat pembeli atau penjual secara sejarah.
**Fasa 2: Pengenalpastian Zon Pengumpulan**
Setelah pivot dikesan, penunjuk mengelompokkan yang berdekatan antara satu sama lain (dalam ambang yang boleh dikonfigurasikan). Apabila beberapa pivot tertumpu dalam julat harga yang sempit, ini menunjukkan zon pengumpulan - kawasan di mana harga telah berulang kali ditolak.
**Fasa 3: Pengesahan Pecahan**
Penunjuk sabar menunggu sehingga harga berjaya:
1. Ditutup di atas (pecahan menaik) atau di bawah (pecahan menurun) zon yang dikenal pasti
2. Dilakukan dengan lilin berarah yang kuat (tutup jauh dari buka)
3. Melepasi tinggi/rendah jangka pendek terkini
**Fasa 4: Pengesahan Akhir**
Sebelum menghasilkan isyarat, ia mengesahkan bahawa:
• Terdapat cukup "sentuhan" sebelumnya dalam zon (minimum boleh dikonfigurasikan)
• Harga tidak baru-baru ini melepasi tahap itu
• Pembukaan lilin pecahan berada dalam julat yang sah
________________________________________
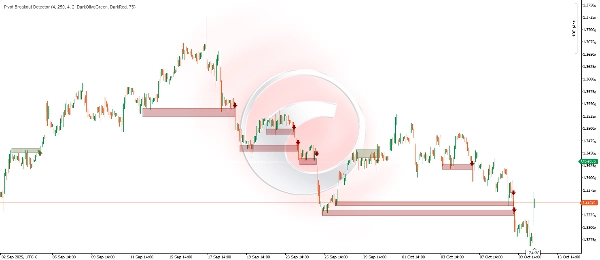
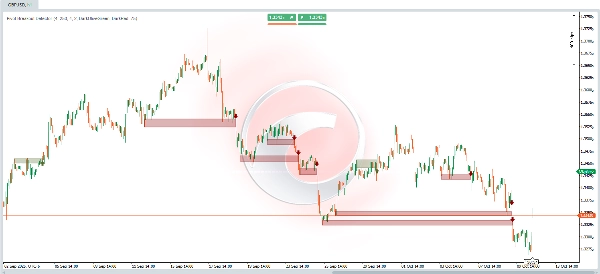
📈 **Interpretasi Visual**
**Elemen pada Carta:**
🟢 **Segiempat Hijau Zaitun (Pecahan Menaik)**
• Kawasan hijau teduh: Mewakili kawasan rintangan yang telah dilepasi
• Sempadan atas dan bawah: Mengehadkan zon pengumpulan sebelumnya
• Sambungan mendatar: Menunjukkan dari bila zon itu dibentuk sehingga saat pecahan
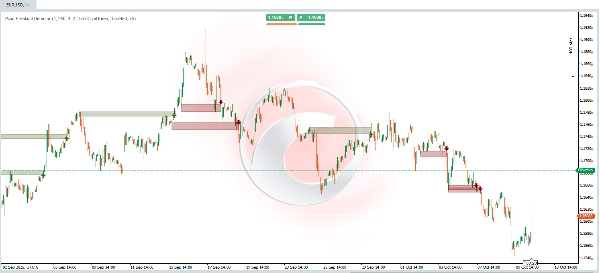
🔴 **Segiempat Merah Gelap (Pecahan Menurun)**
• Kawasan merah teduh: Mewakili kawasan sokongan yang telah pecah
• Fungsi: Sama seperti segiempat hijau tetapi untuk pergerakan menurun
⬆️ **Anak Panah Hijau Ke Atas**
• Lokasi: Di bawah lilin yang mengesahkan pecahan menaik
• Maksud: Isyarat kemasukan panjang berpotensi (beli)
• Tafsiran: Harga telah memecah rintangan dengan kekuatan
⬇️ **Anak Panah Merah Ke Bawah**
• Lokasi: Di atas lilin yang mengesahkan pecahan menurun
• Maksud: Isyarat kemasukan pendek berpotensi (jual)
• Tafsiran: Harga telah memecah sokongan dengan kekuatan
________________________________________
⚙️ **Parameter Boleh Konfigurasi**
1. **Panjang Pengesanan Ayunan (Default: 4)**
• Apa yang dikawal: Tempoh analisis untuk mengesan pivot penting
• Nilai rendah (2-3): Mengesan pivot yang lebih kecil dan lebih kerap, menghasilkan lebih banyak isyarat tetapi mungkin lebih banyak palsu
• Nilai tinggi (7-10): Mengesan hanya pivot utama dan lebih boleh dipercayai, menghasilkan isyarat yang lebih sedikit tetapi berkualiti tinggi
• Cadangan: 4 untuk dagangan harian, 8-10 untuk dagangan ayunan
2. **Bar Sejarah Zon (Default: 250)**
• Apa yang dikawal: Berapa banyak lilin ke belakang penunjuk "mengingati" pivot untuk membentuk zon
• Nilai rendah (30-100): Fokus pada zon terkini, lebih responsif terhadap perubahan struktur
• Nilai tinggi (200-300): Menganggap zon sejarah yang lebih lama, berguna untuk mengenal pasti tahap jangka panjang
• Cadangan: 150-200 untuk jangka masa intrahari, 250-300 untuk harian atau lebih tinggi
3. **Peratus Lebar Zon (Default: 4%)**
• Apa yang dikawal: Ketebalan "kawasan toleransi" untuk mengelompokkan pivot ke dalam zon
• Nilai rendah (1-2%): Zon sangat tepat, memerlukan beberapa sentuhan hampir tepat
• Nilai tinggi (5-8%): Zon lebih luas, lebih permisif apabila mengelompokkan tahap berdekatan
• Cadangan: 2-3% untuk instrumen volatiliti rendah (forex utama), 4-6% untuk mata wang kripto
4. **Sentuhan Ayunan Minimum (Default: 2)**
• Apa yang dikawal: Bilangan minimum kali harga mesti "menguji" zon sebelum menganggapnya sah
• Nilai rendah (1-2): Lebih banyak isyarat, termasuk zon yang kurang kukuh
• Nilai tinggi (3-5): Hanya zon yang sangat disahkan, isyarat lebih sedikit tetapi lebih boleh dipercayai
• Cadangan: 2 untuk dagangan aktif, 3-4 untuk posisi lebih konservatif
________________________________________
📊 **Contoh Praktikal**
🔵 **Contoh Pecahan Menaik**
**Konteks Sebelumnya:** Harga telah berayun selama beberapa sesi antara $48.50 dan $49.20. Semasa tempoh pengumpulan ini, harga cuba melepasi tahap $49.00 sebanyak tiga kali berbeza, tetapi setiap kali ia ditolak, menghasilkan pivot tinggi pada tahap yang hampir sama.
**Pembentukan Zon:** Penunjuk secara automatik mengenal pasti tiga pivot tinggi ini yang tertumpu antara $48.90 dan $49.10, membentuk "zon rintangan" yang jelas. Zon ini dilukis sebagai segiempat hijau zaitun separa telus yang melintang secara mendatar dari sentuhan pertama hingga kini.
**Saat Pecahan:** Dalam sesi semasa, harga dibuka pada $48.80, naik dengan kuat dan ditutup pada $49.35. Lilin ini memenuhi semua kriteria:
• ✅ Ditutup di atas zon rintangan ($49.10)
• ✅ Ia adalah lilin menaik yang kuat (tutup jauh di atas buka)
• ✅ Melepasi tinggi 4 lilin sebelumnya
• ✅ Zon itu mempunyai sekurang-kurangnya 2-3 sentuhan yang disahkan
**Isyarat Dihasilkan:** Anak panah hijau menunjuk ke atas muncul di bawah lilin pecahan, dan segiempat hijau zaitun "tertutup" pada masa itu, menunjukkan secara visual keseluruhan struktur: dari tempat rintangan dibentuk hingga tempat ia pecah.
**Tafsiran Pedagang:** Ini adalah isyarat beli berpotensi. Pecahan menunjukkan bahawa pembeli akhirnya mengatasi rintangan yang menahan harga, dan pergerakan menaik yang lebih berterusan mungkin bermula. Pedagang boleh mempertimbangkan:
• Masuk panjang pada penutupan lilin atau pada pullback ke zon yang pecah (sekarang sokongan)
• Stop loss di bawah zon ($48.70)
• Sasaran berdasarkan ketinggian zon yang dijangka ke atas
________________________________________
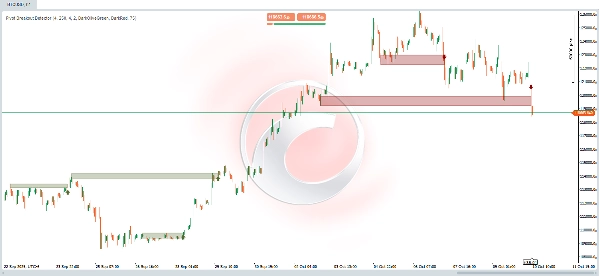
🔴 **Contoh Pecahan Menurun**
**Konteks Sebelumnya:** Harga berada dalam fasa pengedaran sekitar $102.00 selama hampir dua minggu. Pada empat kesempatan berbeza, harga cuba jatuh di bawah $101.50 tetapi diselamatkan oleh pembeli, menghasilkan pivot rendah dalam zon yang sangat sempit.
**Pembentukan Zon:** Penunjuk mengesan empat pivot rendah ini yang dikelompokkan antara $101.40 dan $101.70, mengenal pasti "zon sokongan" institusi yang jelas. Kawasan ini ditandakan dengan segiempat merah separa telus yang mendokumentasikan keseluruhan sejarah pertahanan pada tahap ini.
**Saat Pecahan:** Semasa sesi yang tidak stabil, harga dibuka pada $101.80, berita negatif memberi kesan kepada pasaran, dan harga merosot menutup pada $100.95. Lilin pecahan ini menunjukkan:
• ✅ Ditutup jelas di bawah zon sokongan ($101.40)
• ✅ Ia adalah lilin menurun yang kuat (tutup jauh di bawah buka)
• ✅ Memecah rendah 4 sesi terakhir
• ✅ Sokongan telah diuji 4 kali sebelumnya
**Isyarat Dihasilkan:** Anak panah merah menunjuk ke bawah muncul di atas lilin pecahan. Segiempat merah gelap lengkap, mendokumentasikan secara visual keseluruhan tempoh pembentukan dan titik tepat keruntuhan sokongan.
**Tafsiran Pedagang:** Ini adalah isyarat jual berpotensi. Pecahan menunjukkan bahawa penjual akhirnya memecah lantai yang menyokong harga, mencadangkan trend menurun boleh berterusan. Pertimbangan termasuk:
• Masuk pendek pada penutupan atau pada pullback gagal ke zon yang pecah (sekarang rintangan)
• Stop loss di atas zon ($102.00)
• Sasaran dikira dengan meramalkan ketinggian zon ke bawah
________________________________________
💡 **Petua Penggunaan**
✅ **Amalan Terbaik:**
1. Sahkan dengan volum: Pecahan sebenar biasanya disertai dengan peningkatan volum
2. Konteks trend: Pecahan dalam arah trend utama mempunyai kebarangkalian kejayaan yang lebih tinggi
3. Masa menunggu: Tidak semua isyarat mesti didagangkan serta-merta; tunggu pengesahan tambahan jika perlu
4. Pengurusan risiko: Sentiasa gunakan stop loss berdasarkan struktur zon yang pecah
Ringkasan
Key features include:
- Automatic detection of significant pivot points and consolidation zones.
- Breakout confirmation based on candle strength and price action.
- Validation requiring multiple prior touches of the zone to reduce false signals.
- Visual cues on the chart: olive green rectangles and upward arrows for bullish breakouts; dark red rectangles and downward arrows for bearish breakouts.
- Configurable parameters such as swing detection length, zone history depth, zone width, and minimum touches to tailor sensitivity and reliability.
The indicator supports various markets including Forex, cryptocurrencies, stocks, and major symbols like BTCUSD, EURUSD, GBPUSD, XAUUSD, and NAS100. It aids traders in spotting confirmed breakout opportunities, visualizing critical price levels, and managing risk with structural stop-loss placement.