"Fractal MSS with 4hr bias" logo
Indicator
Version 1.0, Mar 2026
Windows, Mac
4.5
Reviews: 2
"Fractal MSS with 4hr bias" uploaded image
2
Sales

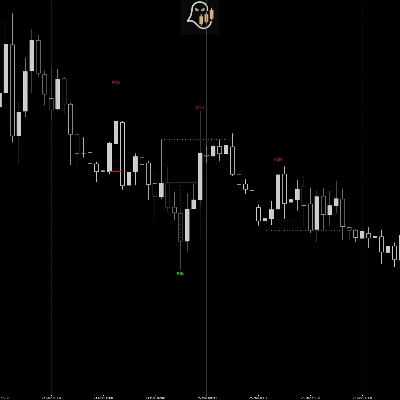
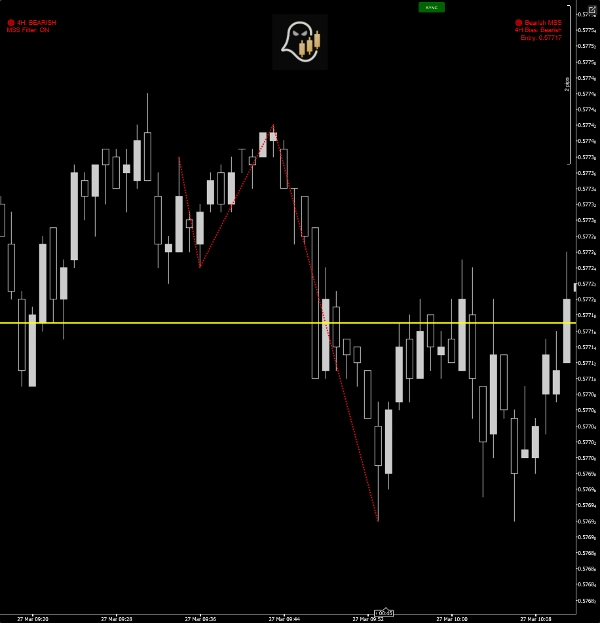
The indicator detects MSS (Market Structure Shift) patterns built from fractal highs and lows.

A valid MSS requires:

  1. A sequence of 4 fractal swing points
  2. A break of the previous swing structure
  3. Confirmation in the opposite direction
  4. Optional confirmation from 4H bias

When detected, the indicator provides:

  • Visual pattern lines
  • Fibonacci entry level (50%)
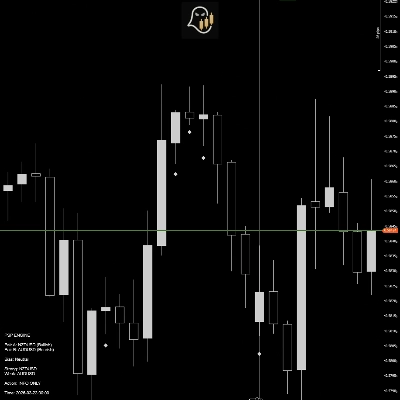
  • On-chart alert panel
  • Optional sound alert
  • Bias direction display
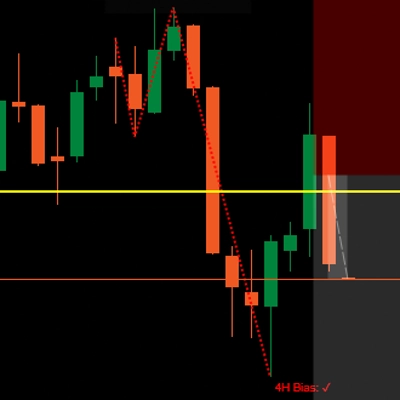
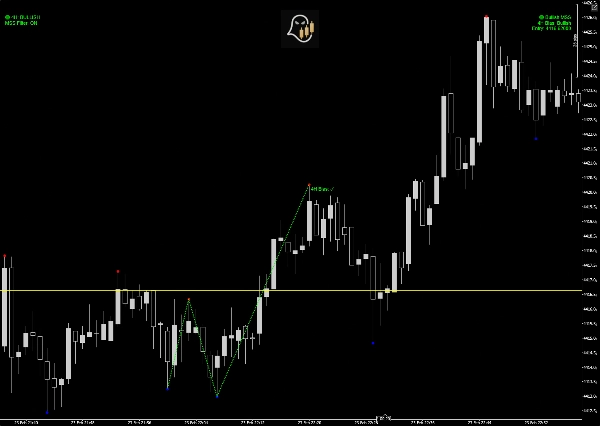
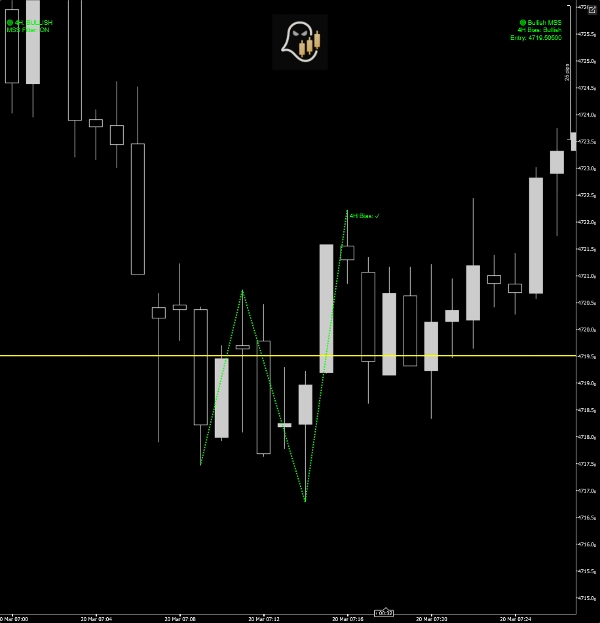
    4-HOUR BIAS FILTER

When enabled, the indicator filters signals using the previous 4H candle.

  • Bullish 4H candle → only bullish MSS shown
  • Bearish 4H candle → only bearish MSS shown

This prevents trading against higher-timeframe momentum.

The bias is updated automatically every few minutes and displayed on chart.

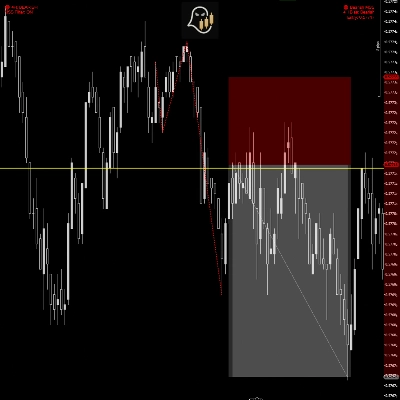
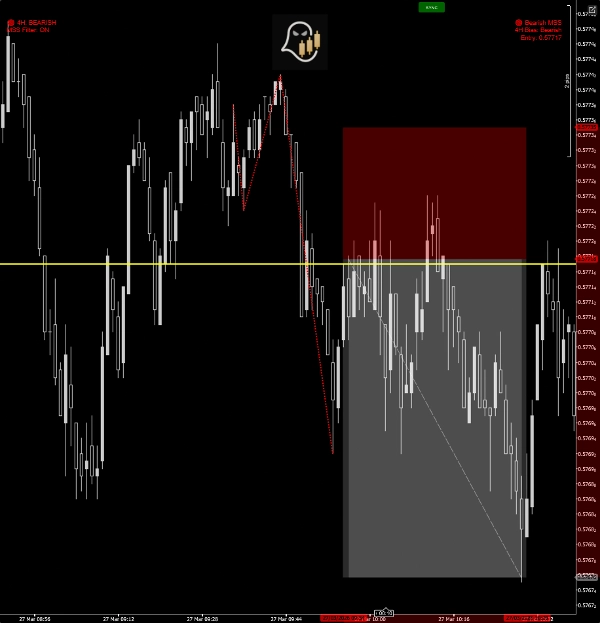
FIBONACCI ENTRY LEVEL

After detecting MSS, the indicator calculates:

50% retracement between the last two swing points

This level represents:

  • Institutional re-entry zone
  • Optimal pullback area
  • Risk-efficient entry price

The level is drawn as a horizontal line.
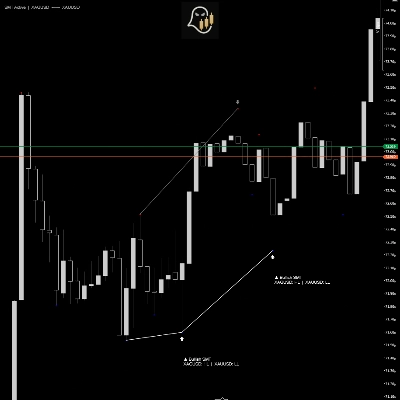
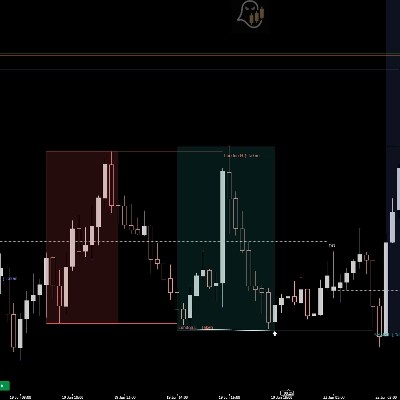
VISUAL OUTPUTS

When a pattern forms, the indicator displays:

✔ Pattern lines

Connects swing points visually

✔ Fibonacci 50% level

Entry zone highlighted on chart

✔ Bias display panel

Shows current 4H directional bias

✔ MSS alert panel

Displays active signal and entry level

✔ Sound alert (optional)
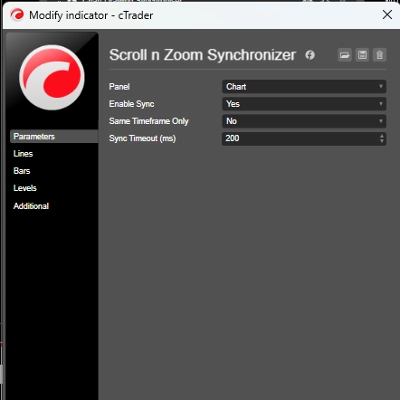
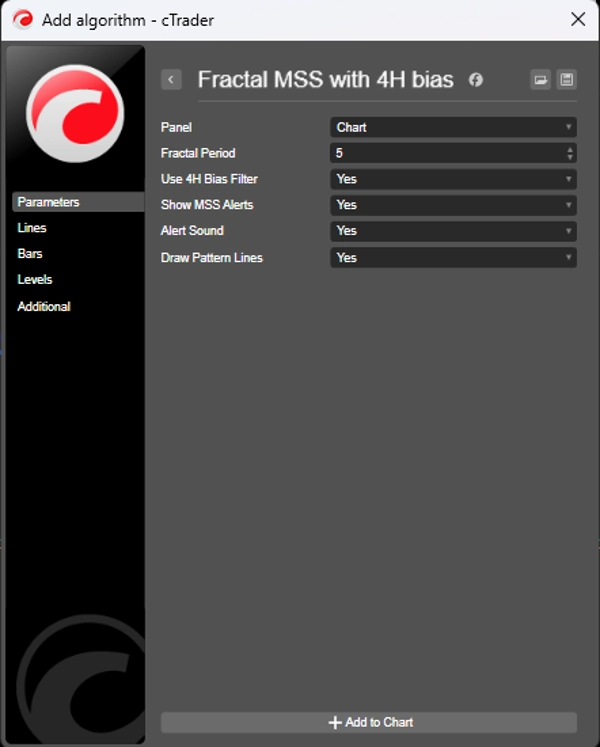

INPUT PARAMETERS

Fractal Period

Controls swing sensitivity.

  • Lower value → more signals
  • Higher value → stronger swings only


Use 4H Bias Filter

Filters signals based on higher timeframe.

Recommended: ON


Show MSS Alerts

Displays signal text on chart.


Alert Sound

Plays notification when MSS forms.


Draw Pattern Lines

Shows visual structure on chart.

Disable if you want only alerts.


HOW TO TRADE WITH THE INDICATOR

Step 1

Wait for MSS detection.

Step 2

Confirm bias alignment.

Step 3

Mark the 50% Fibonacci level.

Step 4

Wait for price to retrace into zone.

Step 5

Enter in direction of MSS.

Indicator profile
4.5
Reviews: 2
5
50 %
4
50 %
3
0 %
2
0 %
1
0 %
Customer reviews
April 2, 2026
March 31, 2026
a 1R exit plan makes review easier. The decision feels less rushed.
Forex
Signal
Indices
Commodities
SMC
Products available through cTrader Store, including trading bots, indicators and plugins, are provided by third-party developers and made available for informational and technical access purposes only. cTrader Store is not a broker and does not provide investment advice, personal recommendations or any guarantee of future performance.

More from this author

Indicator
Forex
Indices
+1
Detects HTF bias using CRT, Expansion & Swing Point patterns with SMT/PSP divergence — visualised in a floating candle
Indicator
SMC
Forex
+3
Fractal MSS with 4H Bias is a smart market-structure indicator designed to detect: Market Structure Shifts (MSS)
Indicator
SMC
EURUSD
+4
PSP is a professional-grade trading tool built to detect candle-level SMT divergence between correlated markets
Indicator
SMC
Forex
+1
Protected Swings identifies critical swing points where institutional money has likely "protected" their positions.
Indicator
Forex
BTCUSD
+9
synchronize scroll position and zoom levels across multiple charts. Perfect for multi-timeframe analysis
Indicator
SMC
Forex
+10
Identify high-probability reversal zones by detecting SMT divergences between correlated pairs in real time

You may also like

Indicator
Imbalance
Key Levels
+4
This indicator combines Multi-Timeframe Liquidity tracking, a dynamic Fair Value Gap (FVG) and a 50% Daily Range
Indicator
BOS
Fibonacci
+4
Automatically draws major trading sessions, killzones, and SMC daily liquidity targets directly on your cTrader charts.
Indicator
AI
RSI
+18
Session boxes with UTC offset, OR logic, adjustable opacity, and multi-day lookback.
Indicator
ATR
Volume
+2
Heatmap Liquidity Zones Visualize volume-at-price, uncover hidden support/resistance, and track market liquidity in real
Indicator
Forex
Crypto
+3
Consecutive Series Moves — Reveal the True Pulse of Price Action
Indicator
Candle Timer & Strength Panel for cTrader Description: Candle Timer & Strength Panel is an advanced, always-visible over
Indicator
SMC
Prop
+14
BoS ChoCH Pro,Strict Mode,False Breakout Filter,Average hit rate: 72-78%
Indicator
Breakout
Allow trader to visualize Support & Resistance across different timeframes,give trader an overview of the current market
Indicator
ATR
Channel
+1
Bollinger Bands Advanced Squeeze & Breakout System, Real-Time On-Chart Dashboard, Auto-Squeeze Detector, Dual-Band Cloud
Indicator
RSI
Breakout
+1
Dynamically adjusts regression channels based on ZigZag extremes, resetting when price breaks bands to track real trends
Indicator
Moving Average
An Indicator made for scalping. Shows you the Sniper movement on Chart with the colour signals.
Indicator
SMC
Prop
+14
FVG Multi Time Frame Indicator
Indicator
ATR
RSI
+3
🚀 Specialized algorithm is designed to confirm entry and exit points with precision 🎯
Indicator
cTreder Smart SMA
Indicator
EMA
Supertrend
+4
Dynamic dual MA cloud indicator. Identifies trends, crossovers, and pullback entries in real time for any asset.
Indicator
AI
ATR
+23
The ZigZag Trend is a market structure tool that filters out small price fluctuations and highlights major swing.
Indicator
ATR
RSI
+8
Multi-timeframe market-state dashboard: Score (-100..+100) + UP/NEUT/DN per TF, with optional closed-candle arrows.
Indicator
VWAP
Moving Average
Vwap Bands it is highly sought after by professional traders because it includes Standard Deviation Bands
2
Sales