

Beschreibung
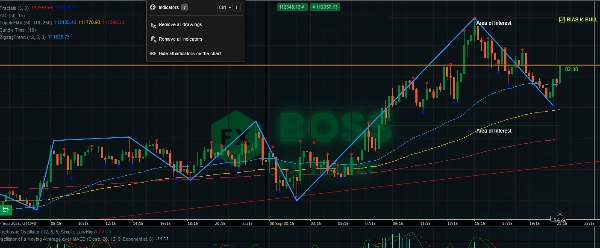
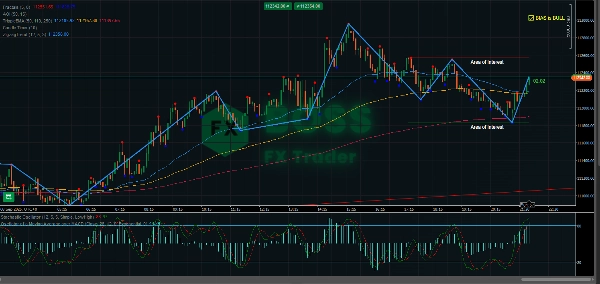
Der ZigZag-Indikator ist ein Marktstruktur-Werkzeug, das kleine Preisschwankungen herausfiltert und wichtige Hoch- und Tiefpunkte hervorhebt. Durch das Verbinden dieser Punkte mit Linien können Trader leicht Trends, Umkehrungen und Chartmuster erkennen.
Er erzeugt nicht von sich aus Kauf-/Verkaufssignale, aber in Kombination mit Preisaktionen, Unterstützungs-/Widerstandsniveaus oder anderen Indikatoren wird er für Scalping-, Intraday- und Swing-Strategien sehr wirkungsvoll.
🔎 Hauptmerkmale
- Vereinfacht Marktrauschen durch Darstellung von klaren Preisschwüngen.
- Hilft bei der Identifikation von Unterstützungs- und Widerstandsniveaus.
- Nützlich zum Erkennen von Chartmustern (Head & Shoulders, Doppelspitzen/-böden, Dreiecke).
- Unterstützt bei der Trendbestätigung und Einstiegen bei Rücksetzern.
- Pfeil-SELL- und BUY-Signal bei jedem Schwung.
⚡ Scalping mit ZigZag
- Zeitrahmen: 1m – 5m
- Ziel: Kleine, aber häufige Bewegungen erfassen.
- Anwendung:
-
- Warten Sie auf die Bildung eines neuen Hochs/Tiefs.
- Markieren Sie diese als Mikro-Unterstützung oder Widerstand.
- Einstiege bei Ausbrüchen oder Rücksetzern zu diesen ZigZag-Niveaus.
- Stop-Loss knapp hinter dem letzten Schwung setzen (enger Risikoabschnitt).
- Schnelles Take-Profit anstreben (5–15 Pips je nach Volatilität).
👉 Funktioniert am besten in Phasen hoher Volatilität (London / New York Eröffnung).
⏱️ Intraday-Handel mit ZigZag
- Zeitrahmen: 15m – 1H
- Ziel: Tages-Trends und wichtige Intraday-Umkehrungen handeln.
- Anwendung:
-
- Identifizieren Sie den Haupt-Intraday-Trend anhand höherer ZigZag-Schwünge.
- Nutzen Sie ZigZag-Punkte als Pivot-Zonen für Einstiege (Käufe bei Rücksetzern im Aufwärtstrend, Verkäufe bei Rallys im Abwärtstrend).
- Kombinieren Sie mit Oszillatoren (RSI/Stochastik), um überkaufte/überverkaufte Zustände nahe ZigZag-Extremen zu bestätigen.
- Verwenden Sie das vorherige Hoch/Tief als logische SL/TP-Niveaus.
👉 Ideal für Daytrader, die 20–50 Pip-Bewegungen anstreben.
📆 Swing-Trading mit ZigZag
- Zeitrahmen: 4H – Täglich
- Ziel: Große Trendbewegungen und Positions-Trades erfassen.
- Anwendung:
-
- Nutzen Sie ZigZag zur Identifikation der wichtigsten Marktstruktur (höhere Hochs & höhere Tiefs = Aufwärtstrend).
- Einstiege nach Rücksetzern, wenn ein neues Tief im Aufwärtstrend entsteht.
- Stop-Loss unter einem wichtigen Schwung-Tief platzieren.
- Ziel 2–3x Risiko oder nächstes ZigZag-Schwungniveau anpeilen.
- Nutzen Sie ZigZag, um Umkehrmuster zu erkennen (Doppelspitze/-boden, Head & Shoulders) für Ausstiege.
👉 Ideal, um Trades über Tage bis Wochen zu halten.
📌 Profi-Tipps
- Tiefen-Anpassung: Kleiner = empfindlicher (gut für Scalping). Größer = filtert Rauschen (besser für Swing).
- Kombinieren Sie mit Volumen, Trendfiltern oder gleitenden Durchschnitten zur Bestätigung.
- Überprüfen Sie immer einen höheren Zeitrahmen ZigZag vor dem Einstieg – kleine Schwünge innerhalb eines größeren Trends können Fallen sein.
- Nutzen Sie ZigZag zur Validierung von Chartmustern (Dreiecke, Keile).
Bleiben Sie profitabel!


