
Beschreibung
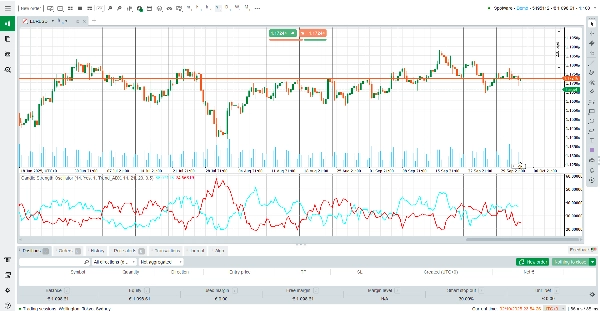
Candle Pressure Index (CPI) ist ein leistungsstarker und dennoch einfach zu verwendender Indikator, der den verborgenen Kauf- und Verkaufsdruck hinter jeder Kerze aufdeckt. Anstatt nur anzuzeigen, ob der Preis gestiegen oder gefallen ist, geht der CPI tiefer und zeigt, wie stark Käufer oder Verkäufer den Markt innerhalb jeder Kerze kontrolliert haben. Dies macht ihn zu einem einzigartigen Werkzeug, um die Trendstärke zu erkennen, Umkehrungen frühzeitig zu identifizieren und Ein- oder Ausstiegspunkte mit höherer Genauigkeit zu bestätigen.
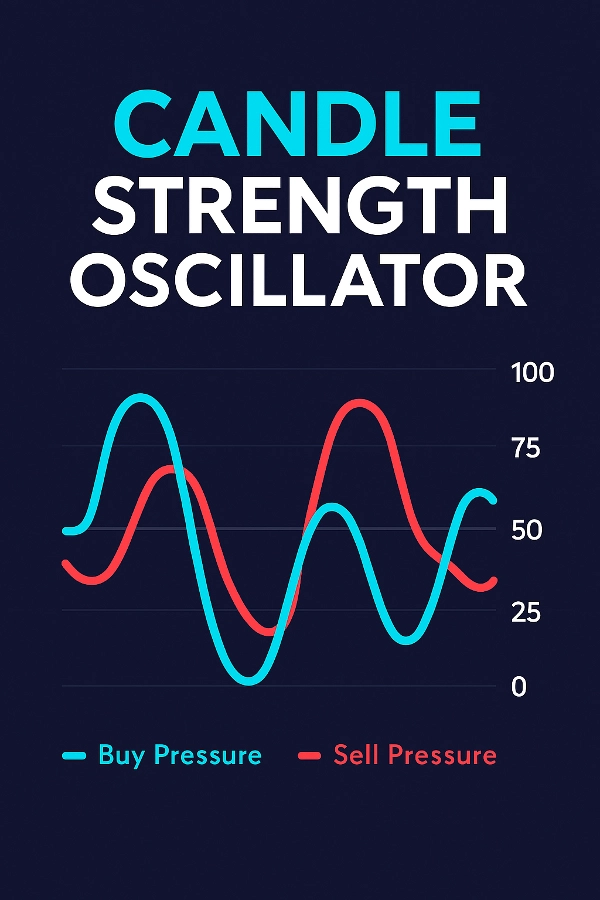
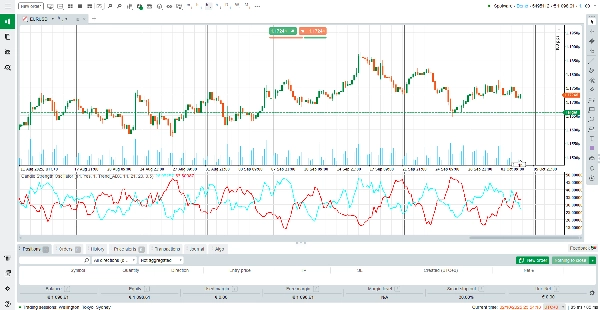
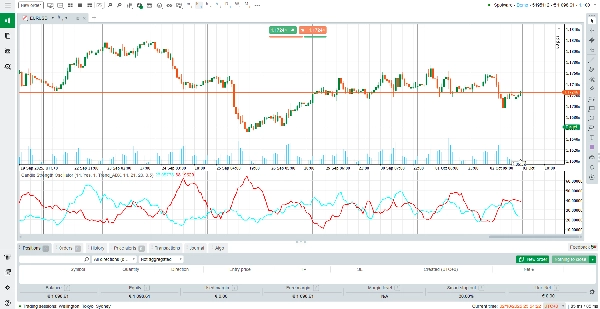
Im Gegensatz zu traditionellen Oszillatoren, die nur auf den Preis reagieren, kombiniert der CPI Kerzenkörperdynamik, Momentum, Volumenbewertung und Trendanalyse (ADX oder EMA), um Ihnen einen umfassenden Überblick über den Marktdruck zu geben. Mit zwei geglätteten Linien – Kaufdruck (cyan) und Verkaufsdruck (rot) – können Händler sofort erkennen, welche Marktseite die Kontrolle hat.
Wie man den Indikator liest
Kaufdruck (Cyan Linie) – Repräsentiert die Intensität der bullischen Kontrolle. Eine steigende Linie zeigt eine zunehmende Dominanz der Käufer.
Verkaufsdruck (Rote Linie) – Repräsentiert die Intensität der bärischen Kontrolle. Eine steigende Linie zeigt eine stärkere Verkaufsdynamik.
Kreuzungen – Wenn die Kauf-Linie die Verkaufs-Linie von unten nach oben kreuzt, signalisiert dies stärkeren bullischen Druck (potenzielle Kaufgelegenheit). Wenn die Verkaufs-Linie nach oben kreuzt, dominiert der bärische Druck (potenzielle Verkaufsgelegenheit).
50-Level-Zone – Werte um die Mitte (≈50) zeigen ein Gleichgewicht zwischen Käufern und Verkäufern an, während extreme Werte (über 75 oder unter 25) starken Richtungsdruck anzeigen.
Trendfaktor-Boost – Der Indikator passt seine Signale basierend auf der Trendbestätigung durch ADX oder EMA-Steigung an und reduziert falsche Signale während Seitwärtsbewegungen.
Wie der Indikator funktioniert
Der CPI berechnet den Druck mithilfe eines gewichteten Modells, das Folgendes berücksichtigt:
Kerzenstruktur: Die Körpergröße und die Schlussposition relativ zum Hoch/Tief.
Momentum: Preisbewegung im Vergleich zur vorherigen Kerze.
Volumen: Tick-Volumen-Gewichtung stellt sicher, dass Bewegungen mit hohem Volumen mehr Bedeutung haben.
Trendabstimmung: Entweder ADX-Stärke oder EMA-Steigung fügt einen Boost-Faktor hinzu, um Signale mit dem vorherrschenden Trend in Einklang zu bringen.
Glättung: Ein benutzerdefinierter SMA-Filter sorgt für glatte und stabile Linien ohne Verlust der Reaktionsfähigkeit.
Diese fortschrittliche Formel bedeutet, dass der CPI nicht nur auf den Preis reagiert, sondern auch versteht, warum sich der Preis bewegt – und Händlern so tiefere Einblicke in das Marktverhalten gibt.
Hauptmerkmale
Duale Linienvisualisierung – Vergleichen Sie sofort Kauf- und Verkaufsdruck mit farbcodierten Linien (cyan für Käufer, rot für Verkäufer).
Adaptiver Trend-Boost – Integriert ADX oder EMA zur Bestätigung der Trendrichtung und zur Reduzierung falscher Signale.
Volumenbewusste Berechnung – Gewichtet nach Tick-Volumen, um Bewegungen hervorzuheben, die von echter Marktteilnahme unterstützt werden.
Geglättete & saubere Anzeige – Eingebauter SMA-Filter für glatte Werte ohne verzögerte Verzerrungen.
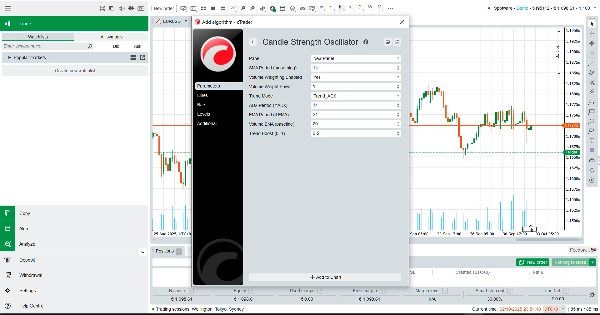
Vollständig anpassbar – Einstellbare Perioden, Gewichtung und Boost-Intensität, um jeden Handelsstil zu unterstützen.
Warum den Candle Pressure Index verwenden?
Der CPI ist perfekt für Händler, die über einfache Kursbewegungen hinausblicken und den wahren Kampf zwischen Käufern und Verkäufern sehen wollen. Egal, ob Sie Scalper, Swing-Trader oder Trendfolger sind, dieser kostenlose Indikator bietet Ihnen die Klarheit, die Sie benötigen, um Einstiege zu timen, Risiken zu managen und mit der tatsächlichen Marktrichtung im Einklang zu bleiben.
Laden Sie noch heute den Candle Pressure Index (CPI) herunter – und handeln Sie mit Vertrauen, indem Sie die verborgenen Kräfte verstehen, die jede Kerze antreiben.
Zusammenfassung
The indicator displays two smooth lines: Buy Pressure (cyan) and Sell Pressure (red). Crossovers between these lines signal shifts in market dominance, helping traders identify trend strength, potential reversals, and optimal entry or exit points. Readings near the midpoint indicate balance, while extremes suggest strong directional pressure.
CPI incorporates volume-weighted calculations and trend-based boosts to reduce false signals during sideways markets. It includes a smoothing filter for stable, responsive readings and offers customization of periods, weighting, and trend boost intensity.
This tool is applicable across various markets including Forex, commodities, stocks, and cryptocurrencies, supporting trading strategies such as scalping and breakout trading. It aims to provide traders with enhanced insight into market dynamics beyond simple price action.
Kundenbewertungen
5 | 0 % | |
4 | 100 % | |
3 | 0 % | |
2 | 0 % | |
1 | 0 % |


![„Gaussian Channel [Iridio Capital]“-Logo](https://cdn.ctrader.com/image/webp/7c039209-5573-4a54-a072-f9528b503103_41960)


