
Beschreibung
Der Indikator basiert auf der Analyse der Preisbewegung 📈, um Veränderungen in der Marktstruktur und wichtige Interessensbereiche zu identifizieren. Nachfolgend eine detaillierte Zusammenfassung, wie er funktioniert:
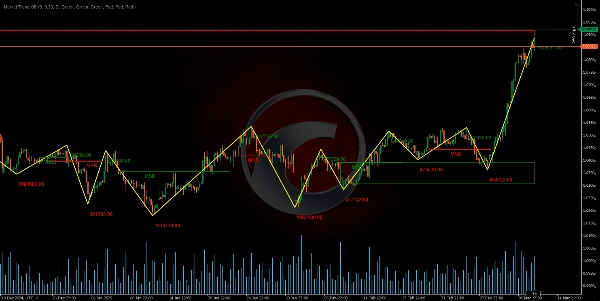
Erkennung von Wendepunkten und Bildung des Zickzack-Musters 🔄
Ein bestimmter Zeitraum (definiert durch einen Längenparameter) wird analysiert, um relative Hoch- und Tiefpunkte zu identifizieren. Durch den Vergleich der Preise innerhalb dieses Intervalls werden Pivot-Punkte (Wendepunkte) erkannt, die wiederum das Zickzack-Muster ⚡ bilden. Dieses Muster hilft dabei zu unterscheiden, wann eine Preisumkehr stattfindet.
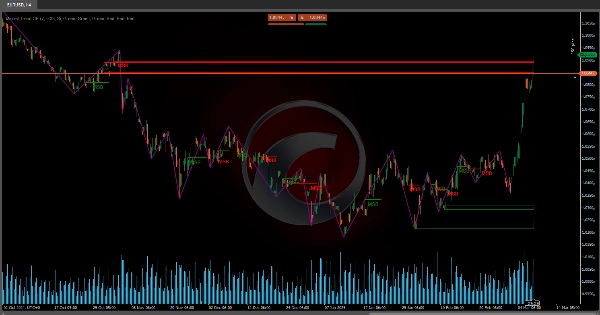
Volumenakkumulation und Abweichungsberechnung 📊
Während des Pivot-Erkennungsprozesses wird das Tick-Volumen im bewerteten Segment akkumuliert. Zusätzlich wird die prozentuale Differenz zwischen den Pivot-Preisen berechnet, um zu bestimmen, ob die Bewegung signifikant genug ist. Diese Abweichung wird mit einem definierten Schwellenwert verglichen, was hilft zu bestätigen, dass die Strukturveränderung echt ✅ ist.
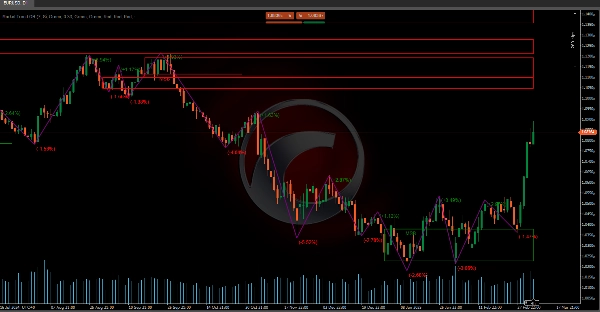
Definition des Marktstrukturbruchs (MSB) 🚨
Der Indikator bewertet die letzten zwei Pivots (ob Hochs oder Tiefs) und bestimmt durch Anwendung eines Retracement-Faktors (inspiriert von Fibonacci-Niveaus), ob ein Strukturbruch stattgefunden hat.
- Wenn nach dem Durchbrechen eines alten Hochs der Preis beginnt, niedrigere Tiefs zu generieren, wird eine Verschiebung zu einer bärischen Struktur identifiziert 🐻.
- Ebenso wird, wenn nach dem Durchbrechen eines alten Tiefs der Preis höhere Hochs generiert, ein Übergang zu einer bullischen Struktur angenommen 🐂.
Diese Veränderung wird als Marktstrukturbruch (MSB) interpretiert.
Identifikation von Order Blocks und Breakout-Boxen 📦
Sobald ein MSB erkannt wird, werden kritische Zonen basierend auf der vorherigen Preisbewegung definiert:
- Order Blocks (OB) 🧱: Diese werden als Zonen identifiziert, in denen die letzte signifikante Aktion vor dem Ausbruch stattfand. In einer bärischen Struktur wird die letzte bullische Kerze vor dem neuen Hoch genommen; in einer bullischen Struktur wird die letzte bärische Kerze vor dem neuen Tief verwendet.
- Breakout-Boxen (BB) 📈: Diese werden ähnlich bestimmt, berücksichtigen jedoch einen zusätzlichen Bereich, um zu bestätigen, dass der Preis das vorherige Niveau durchbrochen hat.
Diese Zonen helfen dabei, Bereiche zu definieren, in denen die Aktivität konzentriert ist und die in Zukunft als Unterstützung oder Widerstand fungieren können.
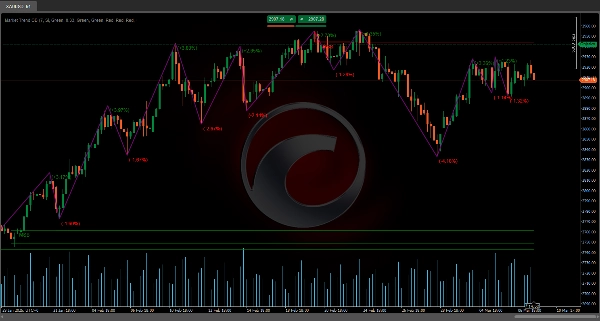
Visualisierung relevanter Zickzack-Daten 📊
Neben der Darstellung der Pivot-Sequenz integriert der Indikator zusätzliche Daten:
- Umkehrpreis 💹: Der genaue Wert, an dem die Trendänderung erkannt wird, wird aufgezeichnet.
- Prozentuale Umkehränderung 🔄: Die prozentuale Veränderung zwischen dem neuen Pivot-Preis und dem vorherigen wird berechnet, was die Größe der Veränderung anzeigt.
- Akkumuliertes Volumen 📉: Die Summe des Tick-Volumens während des Segments, das zur Pivot-Bildung führt, wird angezeigt.
Diese Daten ermöglichen die Bewertung der Stärke und Relevanz der Bewegung, ohne sich auf Annahmen zu stützen, da sie auf konkreten Berechnungen basieren.
Zusammenfassend analysiert das Tool die Preisbewegung, um zu erkennen, wann der Markt den Trend ändert (MSB), und definiert Zonen (Order Blocks und Breakout-Boxen), die für Handelsentscheidungen 💼 entscheidend sein können. Die Integration des Zickzack-Musters mit Volumenanalyse und prozentualen Abweichungen bietet eine umfassende Sicht auf die Marktstruktur und liefert präzise Informationen über Umkehrpunkte und die Stärke der Bewegung 💪.
Ctrader Store Indikatoren:
Dynamic Market Structure
Analysis of Turning Points
Fibonacci Linear
Regression Multi-timeframe
Multi-Level Candle Bias
Tracker
Auto Support and
Resistance Trend Lines
Zusammenfassung
It defines Market Structure Breaks (MSB) by evaluating recent pivots with a retracement factor inspired by Fibonacci levels. A break in structure is signaled when price action shifts from higher highs to lower lows (bearish) or from lower lows to higher highs (bullish).
Upon detecting an MSB, the indicator identifies critical zones: Order Blocks (OB), representing the last significant candle before a breakout, and Breakout Boxes (BB), which confirm price level breaches with an additional range. These zones serve as potential future support or resistance areas.
The tool visualizes relevant zigzag data, including reversal prices, percentage changes, and accumulated volume, enabling assessment of movement strength and relevance based on concrete calculations. This comprehensive approach integrates zigzag patterns, volume analysis, and deviation metrics to provide precise information on reversal points and market movement strength, supporting informed trading decisions.
Kundenbewertungen
5 | 100 % | |
4 | 0 % | |
3 | 0 % | |
2 | 0 % | |
1 | 0 % |


![„[Hamster-Coder] Pivot Points MTF“-Logo](https://cdn.ctrader.com/image/webp/4c143e5a-309c-40e3-a578-f04d1e133ffa_31159)


