
Scalper Signal MTF
Wskaźnik
254 pobrania
Wersja 1.0, Aug 2025
Windows, Mac
Opis
Przegląd
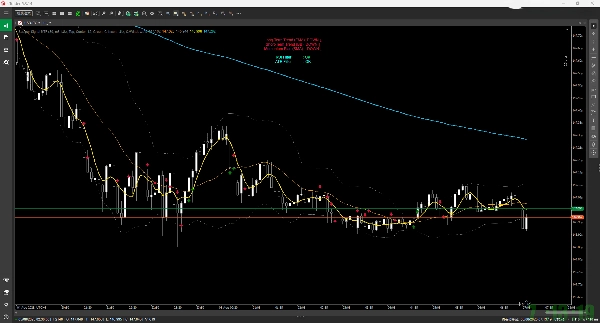
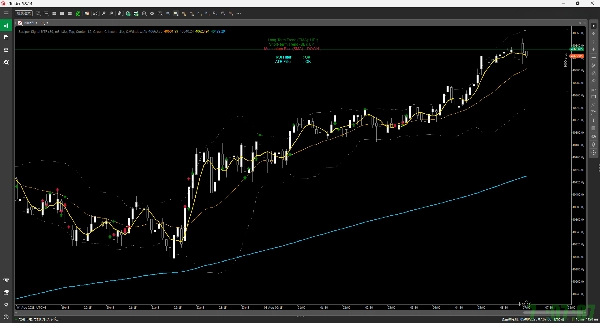
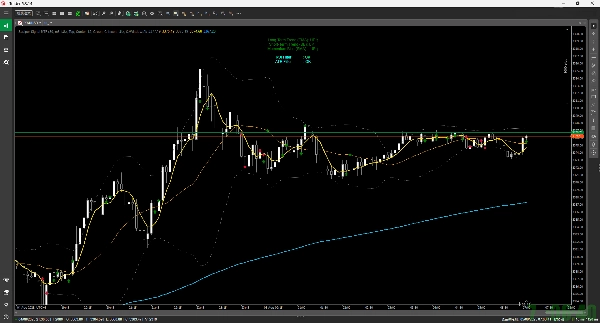
Na podstawie wskaźników technicznych z określonego przedziału czasowego (np. 5-minutowego) wyświetla sygnały kupna/sprzedaży (strzałki) na bieżącym wykresie. Symuluje również transakcje po pojawieniu się sygnału i zaznacza gwiazdką potencjalny punkt wyjścia.
Główne funkcje
- Wyświetlanie sygnałów kupna/sprzedaży:
-
- Sygnał kupna (strzałka w górę): Na podstawie złotego krzyża SMA (Simple Moving Average), w połączeniu z warunkami RSI, 200 EMA i Wstęg Bollingera, aby zidentyfikować korzystne okazje do zakupu.
- Sygnał sprzedaży (strzałka w dół): Na podstawie martwego krzyża SMA, w połączeniu z warunkami RSI, 200 EMA i Wstęg Bollingera, aby zidentyfikować korzystne okazje do sprzedaży.
- Symulacja transakcji:
-
- Po sygnale zakłada, że transakcja zostaje zamknięta, jeśli spełniony jest którykolwiek z poniższych warunków, i oznacza wykres ikoną gwiazdki:
-
- Take Profit / Stop Loss (na podstawie ATR i określonego stosunku ryzyka do zysku).
- Dotknięcie Wstęg Bollingera (górna/dolna wstęga lub linia środkowa).
- Przekroczenie maksymalnego czasu trzymania.
- Również wewnętrznie obliczane są breakeven i trailing stopy.
- Wyświetlanie panelu:
-
- Wyświetla prosty podsumowanie aktualnego środowiska rynkowego w lewym górnym rogu wykresu, w tym trend długoterminowy (EMA), trend krótkoterminowy (BB) oraz momentum (SMA).
- Funkcja alertu:
-
- Dostarcza powiadomienie dźwiękowe, gdy generowany jest nowy sygnał.
Parametry
Możesz swobodnie dostosować następujące elementy w ustawieniach wskaźnika:
- Przedział czasowy używany do obliczeń (MTF).
- Okresy dla różnych wskaźników (SMA, RSI, BB, EMA).
- Zasady wyjścia z transakcji (np. stosunek ryzyka do zysku, maksymalny czas trzymania).
- Ustawienia wyświetlania sygnałów i panelu (widoczność, kolory, rozmiar).
Podsumowanie
Podsumowanie AI
Scalper Signal MTF is a custom indicator designed for the cTrader platform that provides multi-timeframe scalping signals. It analyzes technical indicators from a chosen timeframe—such as 5 minutes—and displays buy (up arrow) and sell (down arrow) signals on the current chart. Buy signals are generated based on an SMA golden cross combined with RSI, 200 EMA, and Bollinger Bands conditions; sell signals use an SMA dead cross with similar criteria.
The indicator simulates trades after signals appear and marks potential exit points with a star icon. Trade exits are triggered by take profit or stop loss levels (calculated using ATR and a specified risk-reward ratio), touching Bollinger Bands, exceeding maximum holding time, or internal breakeven and trailing stop calculations.
A dashboard on the chart’s top-left summarizes the current market environment, showing long-term trend (EMA), short-term trend (Bollinger Bands), and momentum (SMA). The indicator also provides sound alerts when new signals occur.
Users can customize the timeframe for calculations, indicator periods (SMA, RSI, BB, EMA), trade exit rules, and display settings including signal and dashboard visibility, colors, and sizes.
Profil wskaźnika
Opinie klientów
0.0
Opinie: 0
Opinie klientów
Ten produkt nie ma jeszcze opinii. Wypróbowałeś(-aś) go już? Bądź pierwszy(-a) i powiedz o tym innym!
Dyskusja
Częste pytania
Produkty dostępne za pośrednictwem cTrader Store, w tym boty handlowe, wskaźniki i wtyczki, dostarczane są przez deweloperów zewnętrznych i udostępniane wyłącznie w celach informacyjnych oraz w celu zapewnienia dostępu technicznego. cTrader Store nie jest brokerem i nie zapewnia doradztwa inwestycyjnego, nie udziela spersonalizowanych rekomendacji ani nie gwarantuje przyszłych wyników.
Więcej od tego autora


![Logo „High-Low Divergence [Iridio Capital]”](https://cdn.ctrader.com/image/webp/443c4661-7abb-40f1-842f-4b6ec560649b_40914)


Cena
1
Sprzedaż
1.36K
Bezpłatne instalacje