
Der Indikator "Order Block Detector" wurde entwickelt, um Order Blocks (OBs) im Kursdiagramm zu erkennen und anzuzeigen – Schlüsselzonen, in denen große Akteure (Institutionen) bedeutende Kauf- oder Verkaufsaufträge platzieren, die oft starke Kursreaktionen auslösen. Er hilft Tradern, potenzielle Unterstützungs-/Widerstandszonen für intelligentere Trade-Einstiege, Stop-Losses oder Take-Profits zu identifizieren.
Konzept
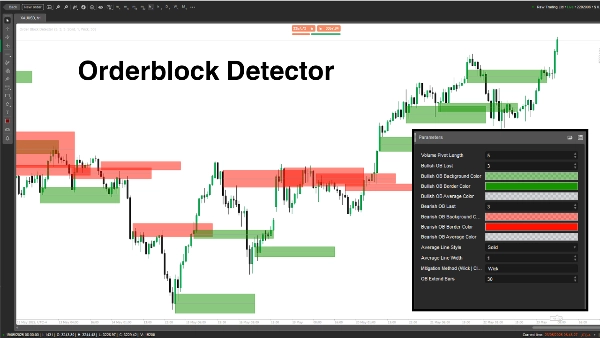
- Order Blocks: Dies sind Kurszonen, in denen sich der Markt aufgrund starker institutioneller Orderflüsse umkehrt oder pausiert. Der Indikator erkennt OBs durch Analyse von Volumen-Pivot-Hochs und Marktstatus (bullisch/bärisch).
- Funktionsweise:
-
- Bestimmt den Marktstatus (bullisch/bärisch) durch Vergleich von Hochs/Tiefs mit einem Rückblickzeitraum (Length).
- Identifiziert OBs an Volumenspitzen, die mit wichtigen Kursniveaus verbunden sind.
- Zeichnet Rechtecke und Durchschnittslinien zur Markierung von OBs und überprüft sowie entfernt abgeschwächte OBs, wenn der Kurs durchbricht.
- Anwendungsfall: Trader können OBs als Zonen mit hoher Wahrscheinlichkeit für Trade-Setups, Risikomanagement oder Gewinnziele nutzen.
Parameteraufteilung
- Volume Pivot Length (Length, Standard: 5, Min: 1)
-
- Was es macht: Legt den Rückblickzeitraum (Anzahl der Balken) für die Berechnung von Hochs/Tiefs und Volumen-Pivot-Hochs fest.
- Warum es wichtig ist: Eine längere Länge erhöht die Genauigkeit, reduziert aber die OB-Häufigkeit; eine kürzere Länge erfasst mehr OBs, kann jedoch Rauschen enthalten.
- Bullish OB Last (BullExtLast, Standard: 3, Min: 1)
-
- Was es macht: Begrenzt die Anzahl der gespeicherten und verfolgten bullischen OBs.
- Warum es wichtig ist: Begrenzt die Anzahl der angezeigten bullischen OBs, um das Chart übersichtlich zu halten und die Leistung zu optimieren.
- Bullish OB Hintergrundfarbe (BgBullCss, Standard: #80169400)
-
- Was es macht: Legt die Hintergrundfarbe und Transparenz der bullischen OB-Rechtecke fest.
- Warum es wichtig ist: Hilft, bullische OBs im Chart visuell zu unterscheiden.
- Bullish OB Rahmenfarbe (BullCss, Standard: #169400)
-
- Was es macht: Definiert die Rahmenfarbe der bullischen OB-Rechtecke.
- Warum es wichtig ist: Verbessert die Sichtbarkeit der bullischen OB-Zonen.
- Bullish OB Durchschnittsfarbe (BullAvgCss, Standard: #609598A1)
-
- Was es macht: Färbt die Durchschnittslinie innerhalb der bullischen OBs.
- Warum es wichtig ist: Markiert den Mittelpunkt des OB als wichtigen Referenzpunkt für Trader.
- Bearish OB Last (BearExtLast, Standard: 3, Min: 1)
-
- Was es macht: Begrenzt die Anzahl der gespeicherten und verfolgten bärischen OBs.
- Warum es wichtig ist: Wie bei BullExtLast hält es das Chart übersichtlich, indem es die Anzahl der bärischen OBs begrenzt.
- Bearish OB Hintergrundfarbe (BgBearCss, Standard: #80FF1100)
-
- Was es macht: Legt die Hintergrundfarbe und Transparenz der bärischen OB-Rechtecke fest.
- Warum es wichtig ist: Unterscheidet bärische OBs von bullischen.
- Bearish OB Rahmenfarbe (BearCss, Standard: #FF1100)
-
- Was es macht: Definiert die Rahmenfarbe der bärischen OB-Rechtecke.
- Warum es wichtig ist: Lässt bärische OBs für eine schnelle Identifikation hervorstechen.
- Bearish OB Durchschnittsfarbe (BearAvgCss, Standard: #609598A1)
-
- Was es macht: Färbt die Durchschnittslinie innerhalb der bärischen OBs.
- Warum es wichtig ist: Hebt das zentrale Kursniveau der bärischen OBs für die Handelsplanung hervor.
- Stil der Durchschnittslinie (LineStyle, Standard: Solid)
-
- Was es macht: Legt den Stil der OB-Durchschnittslinie fest (durchgezogen, gestrichelt, gepunktet).
- Warum es wichtig ist: Passt das Aussehen der Durchschnittslinie an die Vorlieben des Traders an.
- Breite der Durchschnittslinie (LineWidth, Standard: 1, Min: 1)
-
- Was es macht: Passt die Dicke der OB-Durchschnittslinie an.
- Warum es wichtig ist: Steuert, wie auffällig die Durchschnittslinie im Chart erscheint.
- Methode der Abschwächung (Mitigation, Standard: "Wick")
-
- Was es macht: Definiert, wie OBs für ungültig erklärt werden:
-
- Wick: Verwendet den niedrigsten Kurs (bullischer OB) oder höchsten Kurs (bärischer OB) zur Prüfung der Abschwächung.
- Close: Verwendet den Schlusskurs zur Prüfung der Abschwächung.
- Warum es wichtig ist: Beeinflusst, wie sensibel der Indikator auf Kursdurchbrüche von OB-Zonen reagiert und wann OBs entfernt werden.
Der Order Block Detector ist ein leistungsstarkes Werkzeug zur Erkennung institutioneller Orderzonen basierend auf Volumenspitzen und Kursbewegungen. Er zeichnet klare OB-Rechtecke mit Durchschnittslinien und entfernt dynamisch ungültige OBs. Trader können Parameter anpassen, um Erkennung, Anzeige und Verwaltung von OBs an ihren Handelsstil anzupassen.
5 | 100 % | |
4 | 0 % | |
3 | 0 % | |
2 | 0 % | |
1 | 0 % |


