
Compare Symbol
Indikator
200 downloads
Version 1.0, May 2025
Windows, Mac
Beschreibung
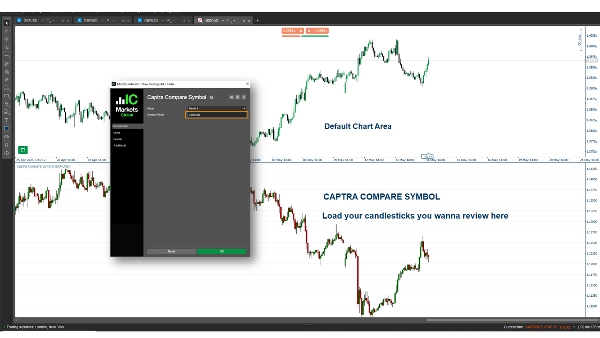
Captra Compare Symbol ist ein cTrader-Indikator, der den Schlusskurs anzeigt und Kerzen (Docht, Körper) für ein ausgewähltes Symbol, wie EURUSD, im Chart zeichnet. Er unterstützt verschiedene Zeitrahmen (z.B. 5M, 15M, 1H, täglich) mit anpassbaren visuellen Darstellungen und verwendet Open/Close/High/Low-Preise für eine genaue Darstellung.
Zusammenfassung
KI-Zusammenfassung
Captra Compare Symbol is a cTrader indicator that visualizes price data of a selected trading symbol, such as EURUSD, directly on the chart. It plots the close price and renders candlesticks—including wicks and bodies—using open, high, low, and close prices for precise representation. The indicator supports multiple timeframes, including 5-minute, 15-minute, 1-hour, and daily intervals. Visual elements are customizable to fit user preferences. This tool enables traders to compare the price action of an additional symbol alongside their primary chart, facilitating multi-symbol analysis within the cTrader platform.
Indikatorprofil
Kundenbewertungen
0.0
Bewertungen: 0
Kundenbewertungen
Bisher gibt es keine Bewertungen für dieses Produkt. Haben Sie es schon ausprobiert? Dann können Sie die erste Person sein, die andere darüber informiert!
Diskussion
Häufig gestellte Fragen (FAQ)
EURUSD
Über den cTrader Store verfügbare Produkte, einschließlich Handelsbots, Indikatoren und Plugins, werden von externen Entwicklern bereitgestellt und nur zu Informations- und technischen Zugriffszwecken verfügbar gemacht. cTrader Store ist kein Broker und erbringt keine Anlageberatung, persönlichen Empfehlungen oder eine Garantie für zukünftige Performance.
Mehr von diesem Autor


Das könnte Sie auch noch interessieren


Preis
86.67M
Gehandeltes Volumen
1.99M
Pip-Gewinn
3.67K
Kostenlose Installationen