
High TF Plotter
Indikator
435 downloads
Version 1.0, May 2025
Windows, Mac
4.6
Bewertungen: 3
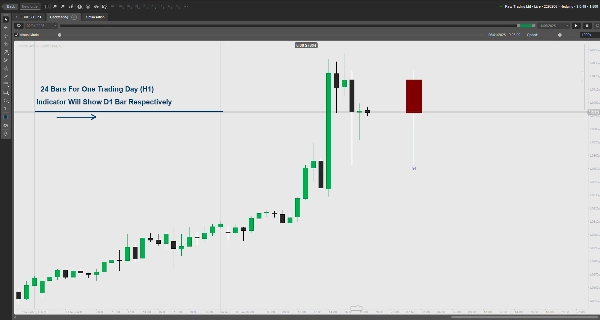
Zeichnet die Kursbewegungen des höheren TF auf niedrigeren TF-Charts. Zeigt Open/Close, Dochte und Schlüsselzonen mit Bullen-/Bärenfarben. Anpassbar.
Hauptmerkmale:
- Überlagert Kursbewegungen höherer Zeitrahmen (z.B. täglich) auf niedrigeren Zeitrahmen-Charts.
- Zeigt Open/Close-Preisrechtecke mit anpassbaren Bullen-/Bärenfarben.
- Hebt Docht-Prämien-/Rabattzonen für wichtige Kursniveaus hervor.
- Konfigurierbarer Abstand für Chart-Abstände.
- Fehlerbehandlung für ungültige Zeitrahmeneinstellungen.
Bitte hinterlassen Sie eine Bewertung, um uns mitzuteilen, ob es hilfreich ist.
Indikatorprofil
4.6
Bewertungen: 3
5 | 67 % | |
4 | 33 % | |
3 | 0 % | |
2 | 0 % | |
1 | 0 % |
Kundenbewertungen
January 27, 2026
It would have been very helpful if it were possible to configure the time for NY EST
August 18, 2025
Clear higher timeframe level plotting, customizable, lightweight. Cons: No auto-labels, no multi-timeframe overlays, no alerts.
May 29, 2025
Muito bom, mas se tivesse a linha de abertura, máxima e mínima seria perfeito. Obrigada.
Über den cTrader Store verfügbare Produkte, einschließlich Handelsbots, Indikatoren und Plugins, werden von externen Entwicklern bereitgestellt und nur zu Informations- und technischen Zugriffszwecken verfügbar gemacht. cTrader Store ist kein Broker und erbringt keine Anlageberatung, persönlichen Empfehlungen oder eine Garantie für zukünftige Performance.
Mehr von diesem Autor


![„[Stellar Strategies] Market Session Ultimate“-Logo](https://cdn.ctrader.com/image/webp/61ffd537-0125-4246-9e72-42eca1791d64_28232)


86.17M
Gehandeltes Volumen
1.91M
Pip-Gewinn
3.57K
Kostenlose Installationen