
Head Shoulders Finder
Gösterge
448 i̇ndirmeler
Sürüm 1.0, May 2025
Windows, Mac
5.0
Değerlendirmeler: 1
Açıklama
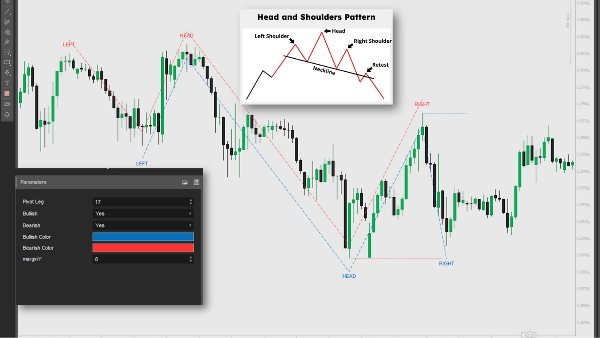
Bu gösterge, fiyat verilerindeki pivot yüksekleri ve düşükleri analiz ederek Baş ve Omuzlar ile Ters Baş ve Omuzlar desenlerini tanımlar. Potansiyel trend dönüşleri için çizgiler, etiketler ve sinyaller çizer; fiyat boyun çizgisinin altına düştüğünde (ayı piyasası) kısa pozisyon koşullarını, üstüne çıktığında ise (boğa piyasası) uzun pozisyon koşullarını tetikler. Tüccarlar, bu sinyalleri kısa veya uzun pozisyonlara girmek için kullanabilir, diğer analizler ve risk yönetimi ile birleştirerek ticaret stratejilerini optimize edebilirler.
Özet
YZ özeti
The Head Shoulders Finder is a technical indicator designed to detect Head and Shoulders and Inverted Head and Shoulders chart patterns by analyzing pivot highs and lows in price data. It visually marks these patterns with lines and labels on the price chart, highlighting potential trend reversal points. The indicator generates trading signals by identifying when the price crosses the neckline: a break below signals a bearish trend reversal suitable for short positions, while a break above indicates a bullish reversal for long positions. Traders can use these signals alongside other technical analyses and risk management strategies to inform entry decisions. This tool supports pattern recognition and signal plotting to assist in identifying potential trading opportunities based on classic reversal formations.
Gösterge profili
Müşteri değerlendirmeleri
5.0
Değerlendirmeler: 1
5 | 100 % | |
4 | 0 % | |
3 | 0 % | |
2 | 0 % | |
1 | 0 % |
Müşteri değerlendirmeleri
August 18, 2025
Automatically detects Head & Shoulders patterns, customizable visuals. Cons: No pattern reliability filter, no alerts, false signals on low TFs.
Tartışma
SSS
cTrader Store üzerinden erişilebilen işlem botları, göstergeler ve eklentiler gibi ürünler, üçüncü taraf sağlayıcılar tarafından sağlanır ve yalnızca bilgilendirme ve teknik erişim amaçlarıyla sunulur. cTrader Store bir broker değildir ve yatırım tavsiyesi, kişisel öneriler vermez veya gelecekteki performansı garanti etmez.
Bu oluşturanın diğer ürünleri


Fiyat
86.67M
İşlem hacmi
1.99M
Kazanılan pip
3.66K
Ücretsiz yüklemeler