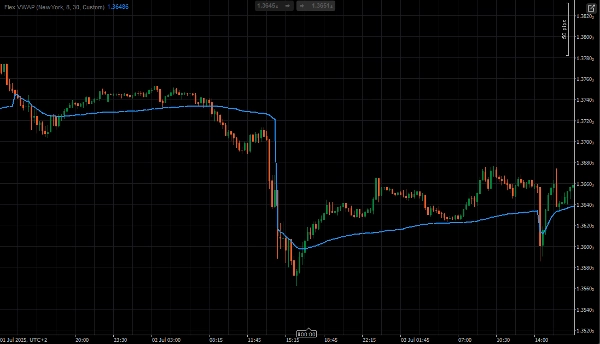
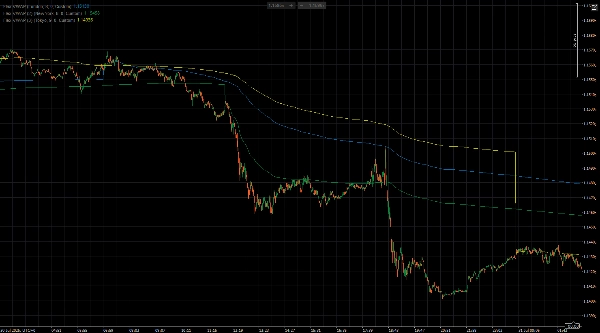
Flex VWAP
Logo "Flex VWAP"
5.0
03/08/2025
98
Desktop
Since 15/06/2025
Free installs
161
Imej yang dimuat naik "Flex VWAP"Imej yang dimuat naik "Flex VWAP"

The Flex VWAP indicator provides a volume-weighted average price calculation with highly customizable reset periods including yearly, monthly, weekly, daily, hourly intervals, and custom time settings. It supports multiple timezone configurations (New York, London, Tokyo, Sydney, Local) allowing traders to align VWAP calculations with specific trading sessions. Users can set custom reset times down to the minute for precise session management and personalized trading strategies. The VWAP line updates in real-time using typical price methodology and provides a reliable reference for institutional trading levels and market bias analysis.

Forex Session Settings
==================

London Session
Base TimeZone: London
Custom Hour: 8
Custom Minute: 0
Reset Period: Custom

New York Session
Base TimeZone: NewYork
Custom Hour: 8
Custom Minute: 0
Reset Period: Custom

Tokyo Session
Base TimeZone: Tokyo
Custom Hour: 9
Custom Minute: 0
Reset Period: Custom


Stock Exchange Session Settings
==========================

London Session
Base TimeZone: London
Custom Hour: 8
Custom Minute: 0
Reset Period: Custom

New York Session
Base TimeZone: NewYork
Custom Hour: 9
Custom Minute: 30
Reset Period: Custom

Tokyo Session
Base TimeZone: Tokyo
Custom Hour: 9
Custom Minute: 0
Reset Period: Custom

Lebih banyak produk daripada penulis ini
Simple MACD Histogram
Simple MACD Histogram with color-coded rising (green) and falling (red) momentum bars.
Anda juga mungkin suka
Fibonacci Pitchfan
Powerful all-in-one tool for traders seeking a clear, dynamic view of market structure. By merging pivots, trendlines &
Indikator
Breakout
3 Bar Triangle by Linda Raschke
3 bar triangle = high below 2 day high, low above 2 day low
overbought oversold
Overbought Oversold Indicator
VolumeColorBar
Color Volume Bars – Visualize Market Strength Instantly
Indikator
Bollinger
Repiptor BB Colored Width
Colored Bollinger Bands Width
Indikator
RSI
Breakout
Lozano Price Action
LPA simplifies trading by coloring candles with volume data and RSI levels for trend and reversal insights.
Indikator
RSI
Breakout
ATR
+2
Channel Breakout System
🚀 Specialized algorithm is designed to confirm entry and exit points with precision 🎯
[Stellar Strategies] BOS Trend 1.0
[Stellar Strategies] BOS Trend: Premium multi-timeframe BOS indicator for precision trend analysis.📈📉
Indikator
Indices
AI
Machine Learning Momentum Index
The Machine Learning Momentum Index (MLMI) represents the next step in oscillator trading.
Indikator
NAS100
NZDUSD
Breakout
+12
RT ATR Bands
Enhance trading with ATR Bands! Visualize market volatility using dynamic upper and lower ATR bands for precise decision
Indikator
Signal
Scalping
[Stellar Strategies] Linear Regression Candles 1.1
Approach to price analysis by visualizing candlestick data through the lens of linear regression slopes 📈📉
Dinilai teratas
Logo "STC"
5.0
(2)
Percuma
STC
Schaff Trend Cycle (STC) Indicator
Indikator
RSI
Breakout
Supertrend
TrendMaster Pro MultiMA
Connects each moving average value from candle to candle, forming a fan-like structure of trendlines.
Indikator
Indices
E7 BlackScholes Model
Option pricing using the BlackScholes model and the Math.Numerics packages
Indikator
NAS100
NZDUSD
XAUUSD
+10
Nebula Range Filter Pro
⚡Nebula Range Filter is a professional trend filter indicator for cTrader⚡
Indikator
Indices
Breakout
Supertrend
[CB] Pivot Points Pro
You can use the cTrader Pivot Points Pro indicator to find a good pullback entry in a trend
Indikator
Grid
RSI
Breakout
+18
Logarithmic Framework by LudwigICT
ZigZag Price Liquidity Projection
📊 ZigZag Liquidity Projection: Predict bounces/breaks using pivots, ATR & volume.