
Descrizione
Indicatore Time To Break Even LITE
Versione Lite
Questa è la versione di prova gratuita dell'indicatore Time To Break Even. È limitata a EURGBP e funzionerà solo per 2 minuti.
Indicatore Time To Break Even
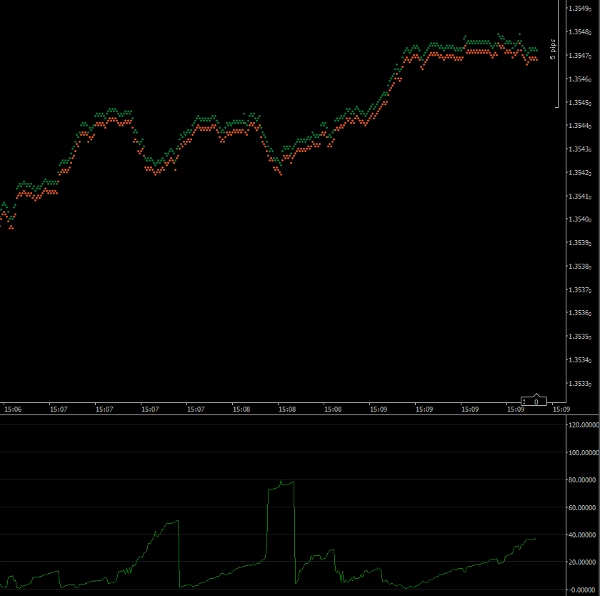
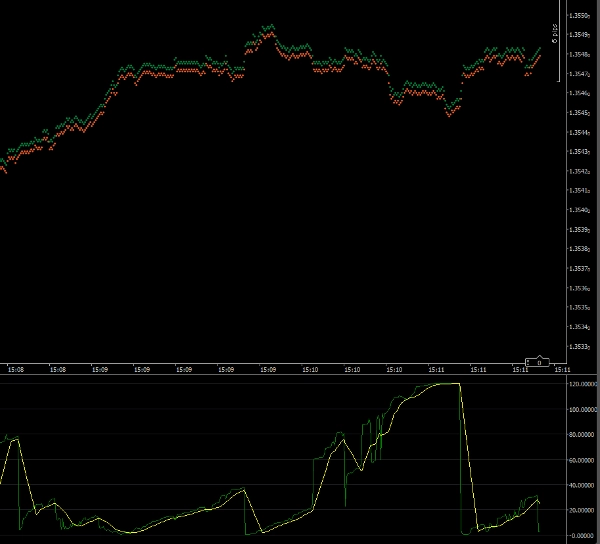
Questo indicatore ti aiuterà a temporizzare l'ingresso del tuo trade nel mercato. Il grafico mostra il probabile numero di secondi necessari affinché il tuo trade raggiunga il pareggio. Se il mercato si muove rapidamente e nella tua direzione, l'indicatore mostrerà un numero piccolo. Se il mercato si muove contro di te o lentamente, il numero sarà più grande.
L'indicatore calcola il numero di pips necessari al tuo trade per raggiungere il pareggio. Poi confronta questo valore con la velocità attuale del movimento del prezzo.
N.B. Questo indicatore dovrebbe essere eseguito sul Time Frame a 1 Tick.
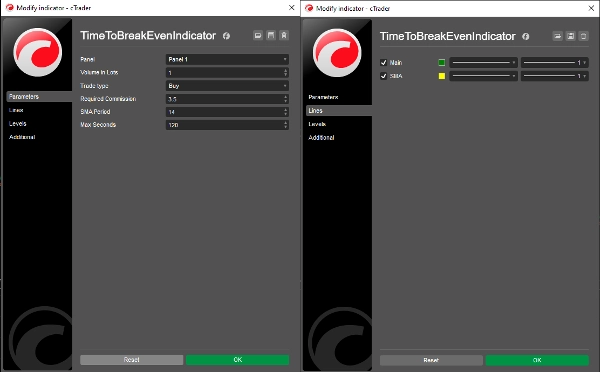
Parametri
Volume in Lotti: Il volume del tuo trade proposto
Tipo di Trade: Se il tuo trade sarà un acquisto o una vendita
Commissione Richiesta: La commissione che il tuo trade comporterà (puoi ottenerla dalla finestra Quick Trade)
Periodo SMA: Il periodo della media mobile semplice (default = 14)
Secondi Massimi: Il numero massimo di secondi che verrà registrato (vedi sotto)
Linee
Principale: La linea del grafico dell'indicatore (default = verde)
SMA: La linea della media mobile semplice (default = giallo)
Secondi Massimi
Consentire all'indicatore di mostrare valori molto grandi significa che la scala dell'indicatore ti impedirà di vedere i dettagli quando il tempo per raggiungere il pareggio è breve. Impostare questo parametro ti permette di definire la scala massima dell'indicatore. Di default è impostato a 120 (2 minuti). Quindi qualsiasi valore pari o superiore a 2 minuti sarà rappresentato come 120 secondi.
Dr Andy Larkin
Copyright 2025, Tutti i diritti riservati
26 Maggio 2025
Legale
I risultati di questo indicatore devono essere verificati per accuratezza prima di essere utilizzati nel trading live.
Non viene fornita alcuna garanzia, esplicita o implicita, per i risultati di questo indicatore.
Non si accetta alcuna responsabilità per eventuali perdite derivanti dall'uso di questo indicatore.


![Logo di "[Hamster-Coder] Bollinger Bands"](https://cdn.ctrader.com/image/webp/21d8e5d6-fb11-4bac-b9ee-cd05c2b76804_30327)


![Logo di "Gaussian Channel [Iridio Capital]"](https://cdn.ctrader.com/image/webp/7c039209-5573-4a54-a072-f9528b503103_41960)