
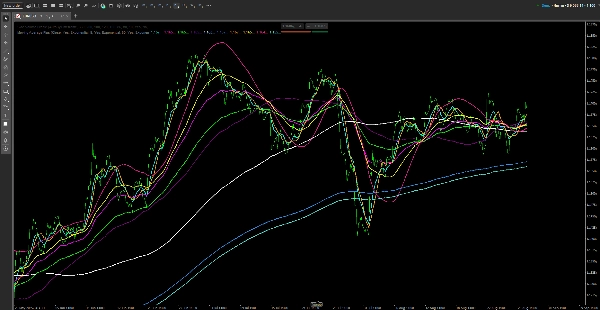
Moving Average Plus
Indicatore
144 download
Versione 1.0, Aug 2025
Windows, Mac
Da 26/05/2025
447.85M
Volume negoziato
60.94K
Profitto in pip
15
Vendite
1.42K
Installazioni gratuite
Descrizione
Globale
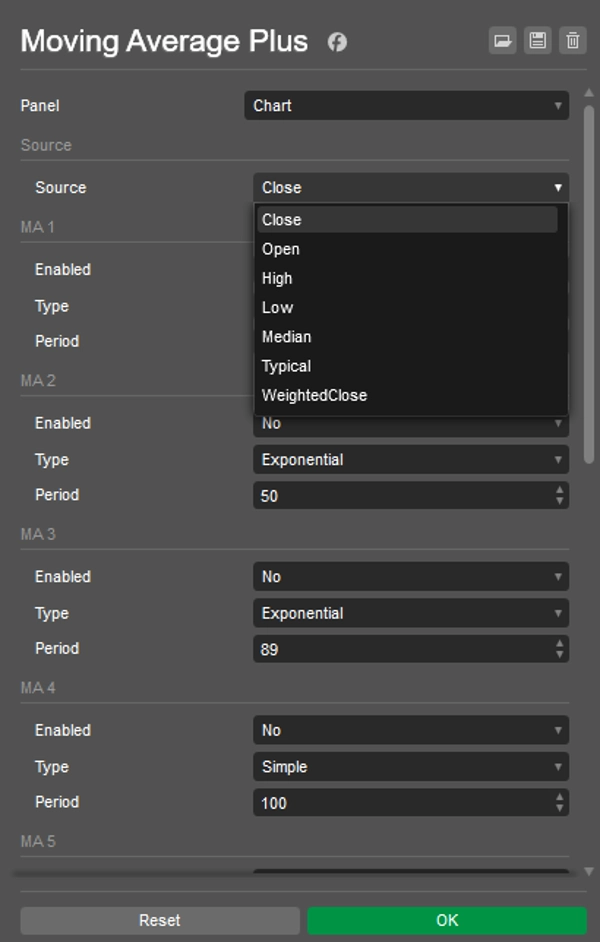
- Fonte – input del prezzo utilizzato da tutte le linee: Close, Open, High, Low, Median, Typical o Weighted Close.
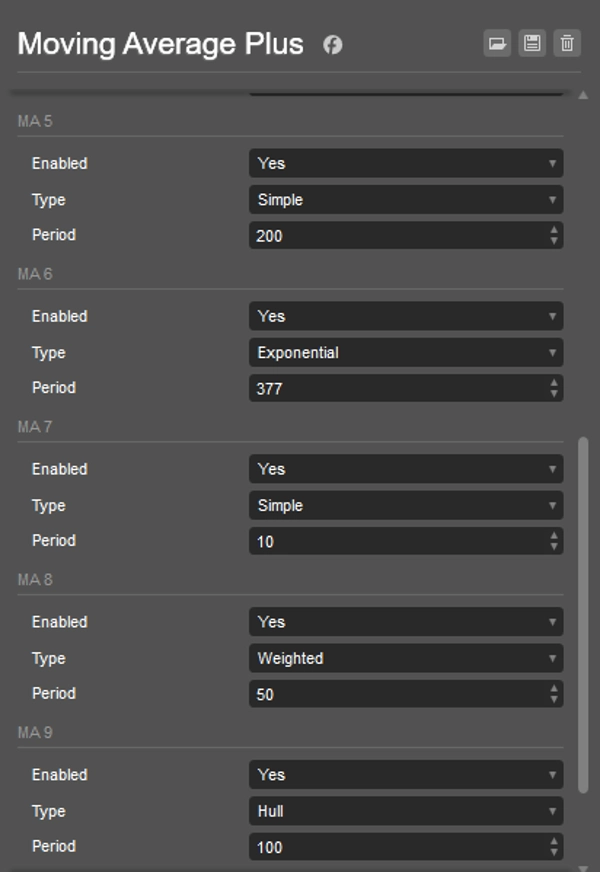
Per linea (MA 1 … MA 10)
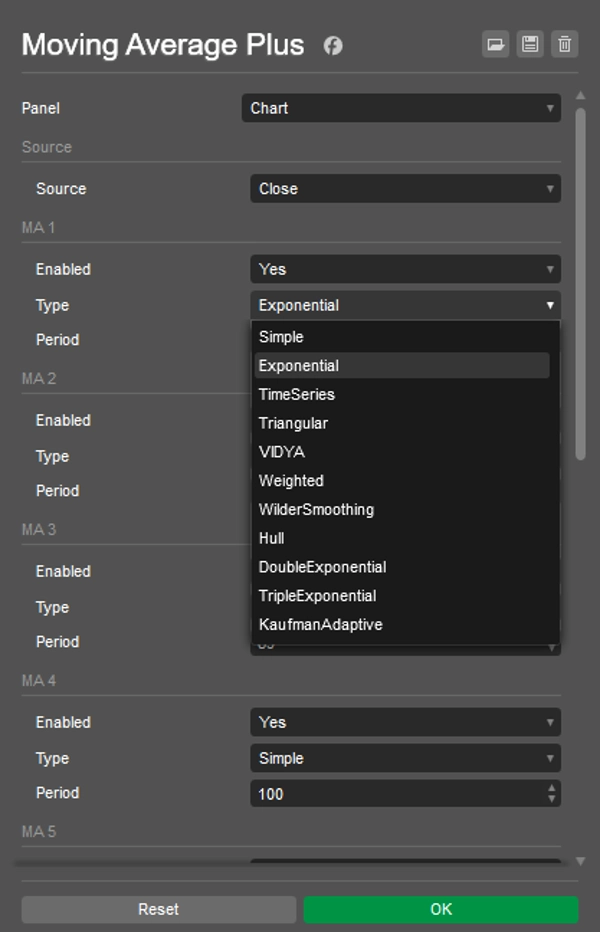
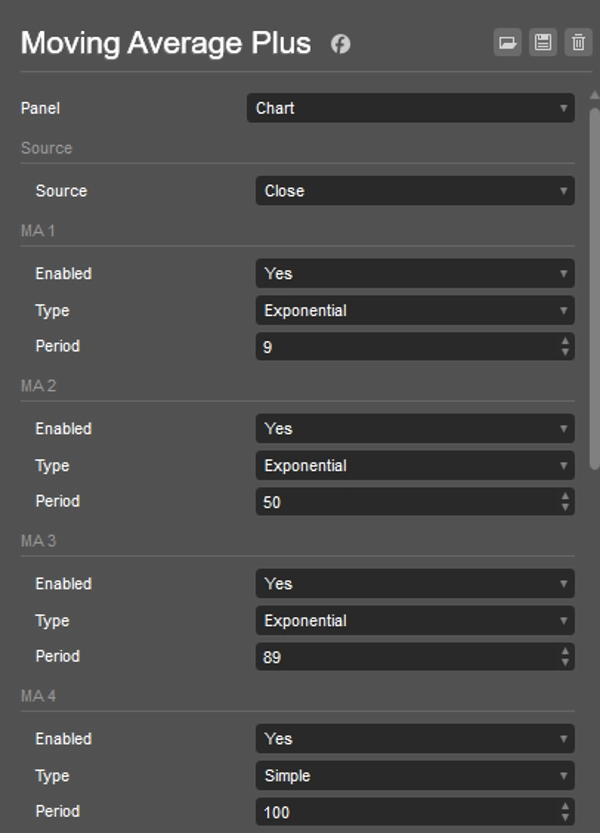
- Abilitato – attiva/disattiva la linea (le linee disabilitate non vengono calcolate).
- Tipo – scegli qualsiasi tipo da
MovingAverageTypedi cTrader (es. Simple, Exponential, Weighted, Wilder Smoothing, Hull, Triangular, Time Series, ecc.).
Nota: alcuni tipi dipendono dalla versione di cTrader; se un tipo non è disponibile (es. Hull), scegli un altro. - Periodo – lunghezza MA (≥1).
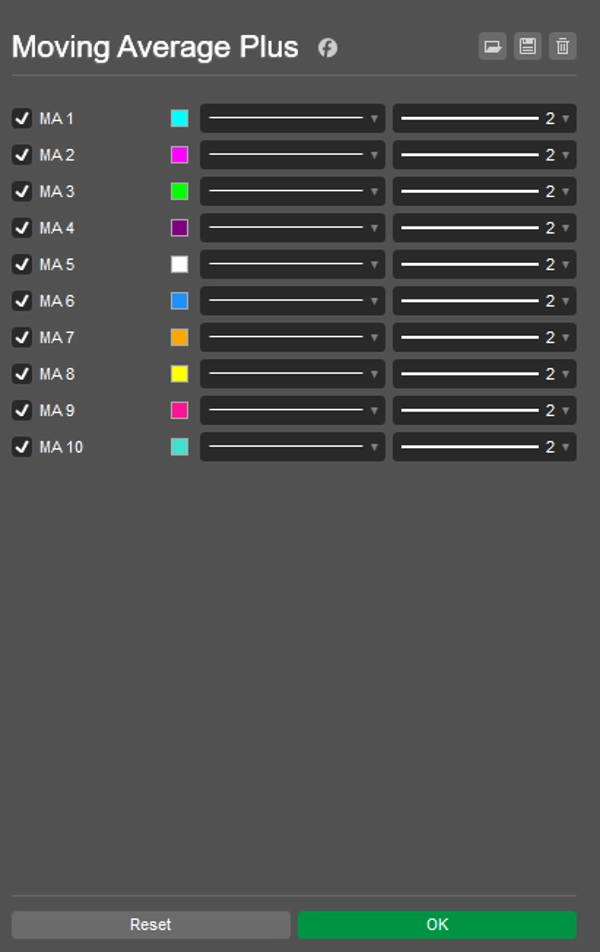
Colori e spessore
- Impostati nella scheda Colori dei parametri dell’indicatore per ogni output (“MA 1” … “MA 10”).
Consigli
- Per migliorare le prestazioni, disabilita le linee inutilizzate.
- Se modifichi Fonte o Tipo/Periodo, l’indicatore si ricalcola automaticamente.
- Wilder in cTrader è chiamato Wilder Smoothing (
MovingAverageType.WilderSmoothing).
Riepilogo
Riepilogo AI
Moving Average Plus is a technical indicator for trading platforms that provides up to 10 configurable moving average lines. Each line can be individually enabled or disabled to optimize performance. Users select a single price source—such as Close, Open, High, Low, Median, Typical, or Weighted Close—that applies to all moving averages. For each line, the type of moving average can be chosen from various options including Simple, Exponential, Weighted, Wilder Smoothing, Hull, Triangular, and Time Series, depending on platform support. The period (length) of each moving average is adjustable with a minimum of 1. Colors and line thickness for each moving average are customizable through the indicator’s color settings. The indicator automatically recalculates when changes are made to the price source, type, or period. This tool is designed to assist traders in analyzing price trends by overlaying multiple moving averages with flexible configurations on their charts.
Profilo indicatore
Recensioni dei clienti
0.0
Recensioni: 0
Recensioni dei clienti
Questo prodotto non ha ancora ricevuto recensioni. L'hai già provato? Fallo sapere agli altri per primo!
Discussioni
Domande frequenti
I prodotti disponibili tramite cTrader Store, inclusi bot di trading, indicatori e plugin, sono forniti da sviluppatori terzi e resi disponibili esclusivamente a scopo informativo e di accesso tecnico. cTrader Store non è un broker e non fornisce consulenze in materia di investimento, raccomandazioni individualizzate o garanzie di risultati futuri.


![Logo di "[Stellar Strategies] Market Session Ultimate"](https://cdn.ctrader.com/image/webp/61ffd537-0125-4246-9e72-42eca1791d64_28232)


Prezzo
Da 26/05/2025
447.85M
Volume negoziato
60.94K
Profitto in pip
15
Vendite
1.42K
Installazioni gratuite