
Descrizione
Come Fare Trading Usando la Strategia Donchian (Breakout)
- Compra quando il prezzo supera il massimo del periodo N (Superiore).
- Vendi quando il prezzo supera il minimo del periodo N (Inferiore).
- Mantieni la posizione mentre la tendenza continua; esci su un breakout opposto o tramite uno stop mobile.
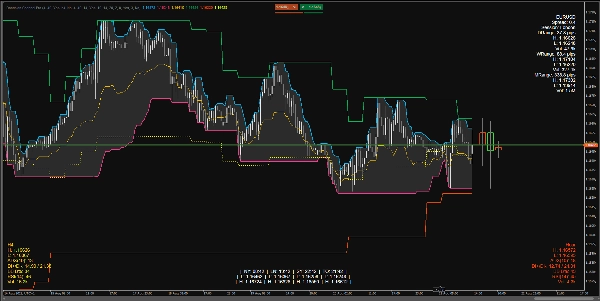
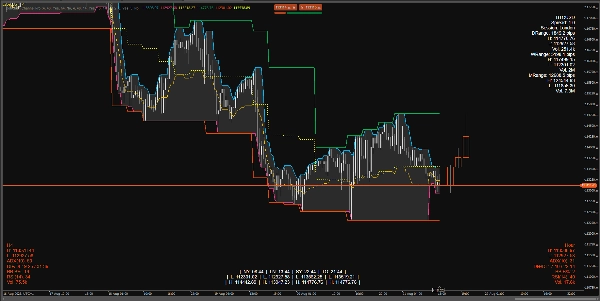
Cosa Mostra l'Indicatore sul Grafico
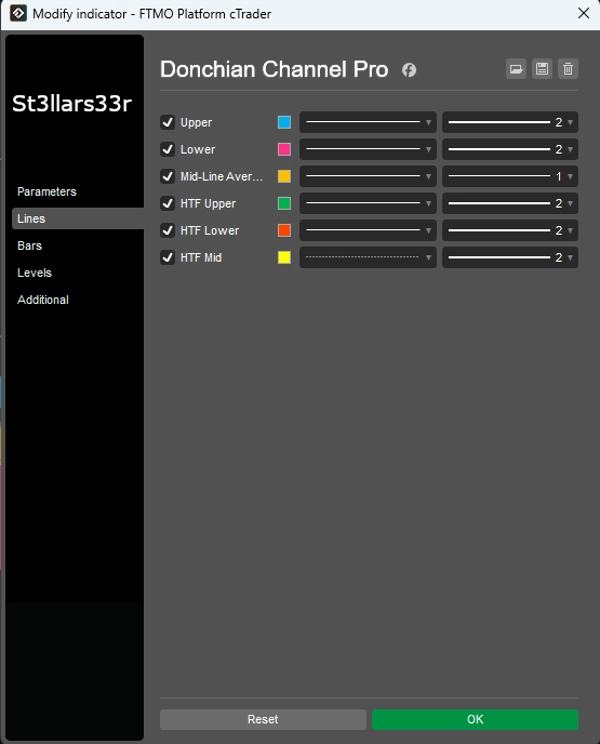
Donchian sul Timeframe Corrente (TF):
- Superiore: Il prezzo più alto sulle barre del Canale Superiore.
- Inferiore: Il prezzo più basso sulle barre del Canale Inferiore.
- Medio: Il punto medio tra Superiore e Inferiore.
Sovrapposizione HTF: Linee Donchian da un timeframe superiore sovrapposte al grafico:
- HTF Superiore, HTF Inferiore, HTF Medio
- HTF Candele HUD: Rettangoli che rappresentano le candele del timeframe superiore, ancorati a destra dell'ultima barra sul TF corrente.
HUD (Heads-Up Displays) in Basso/In Alto:
- In Alto a Destra: Pannello informativo per il simbolo + range giornalieri/settimanali/mensili.
- In Basso a Sinistra: HUD HTF (metriche per il timeframe superiore).
- In Basso a Destra: HUD TF Medio (metriche per il timeframe intermedio).
- In Basso al Centro: Orologi di sessione + Massimi/Minimi per ogni sessione (persistente).
Cosa Mostra Ogni HUD
In Alto a Destra (Top Right)
- Nome Simbolo
- Spread: Spread in pips.
- Sessione: Sessione attiva corrente (basata sulle ore specificate).
- DRange/WRange/MRange: Range giornaliero/settimanale/mensile in pips.
- H/L/Vol: Massimo/Minimo e volume totale per il periodo rispettivo.
In Basso a Sinistra (Bottom Left) — HUD HTF
- Nome TF (es. H4, D1, ecc.)
- H/L: Massimo/minimo corrente dell'ultima barra HTF (o attiva).
- ADX(n), DI+/DI-: Indicatori di tendenza.
- BB B%: Posizione del prezzo corrente rispetto alle Bande di Bollinger su HTF (0 vicino alla banda inferiore, 100 vicino alla banda superiore).
- RSI(n)
- Vol: Volume su HTF.
- Colore HUD:
-
- Verde: Range in espansione verso l'alto (DI+ e ADX in aumento).
- Rosso: Pressione in aumento verso il basso (DI- in aumento).
- Giallo: Neutro/indefinito.
In Basso a Destra (Bottom Right) — HUD TF Medio
- Stesso HUD HTF, ma per il timeframe intermedio (Mid Timeframe).
In Basso al Centro (Bottom Mid) — Orologi + Massimi/Minimi Sessione
- Ora a NY, LN, SY, TO.
- Min/Max per ogni sessione.
- Logica Persistente: Quando una sessione è inattiva, mostra i massimi/minimi dell'ultima sessione completata; quando inizia una nuova sessione, i valori si resettano e ricalcolano.
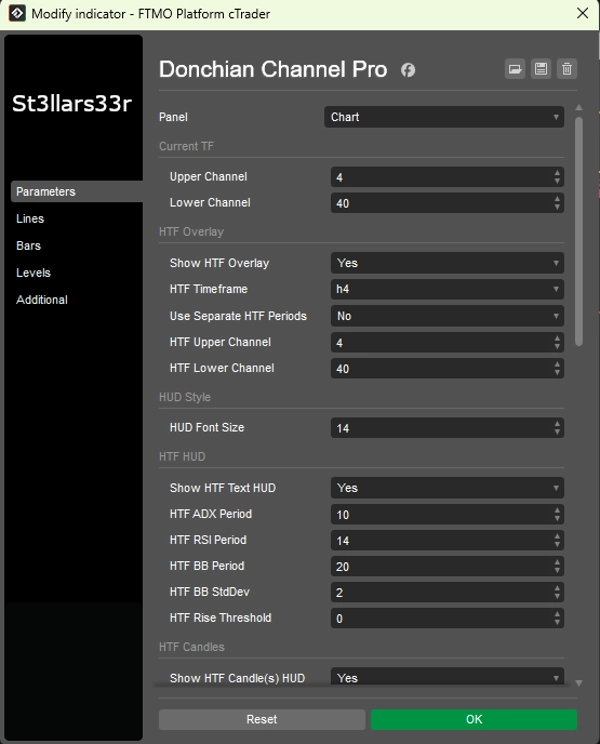
Parametri e Come Usarli
Gruppo: TF Corrente (Donchian Corrente)
- Canale Superiore: Numero di barre per il canale superiore. Valore maggiore = aggiornamenti meno frequenti, linea più piatta.
- Canale Inferiore: Numero di barre per il canale inferiore.
Gruppo: Sovrapposizione HTF (Sovrapposizione Donchian Timeframe Superiore)
- Mostra Sovrapposizione HTF: Abilita le linee HTF sul grafico.
- Timeframe HTF: Seleziona timeframe superiore (es. Hour4).
- Usa Periodi HTF Separati: Se vero, HTF Superiore/Inferiore usano parametri propri; se falso, usa Superiore/Inferiore correnti.
- Canale Superiore HTF: Lunghezza del canale superiore per HTF.
- Canale Inferiore HTF: Lunghezza del canale inferiore per HTF.
Gruppo: Stile HUD
- Dimensione Font HUD: Dimensione del font per tutti gli HUD (TopRight, BottomLeft, BottomRight, BottomMid).
Gruppo: HUD HTF (In Basso a Sinistra)
- Mostra HUD Testuale HTF: Mostra HUD testuale per HTF.
- Periodo ADX HTF: Periodo ADX/DI. Maggiore = più fluido, meno rumore, ma risposta più lenta.
- Periodo RSI HTF: Periodo RSI.
- Periodo BB HTF: Periodo Bande di Bollinger.
- Deviazione Std BB HTF: Moltiplicatore deviazione standard per BB (classico è 2.0).
- Soglia di Crescita HTF: Sensibilità ai parametri in crescita (influisce sul colore HUD).
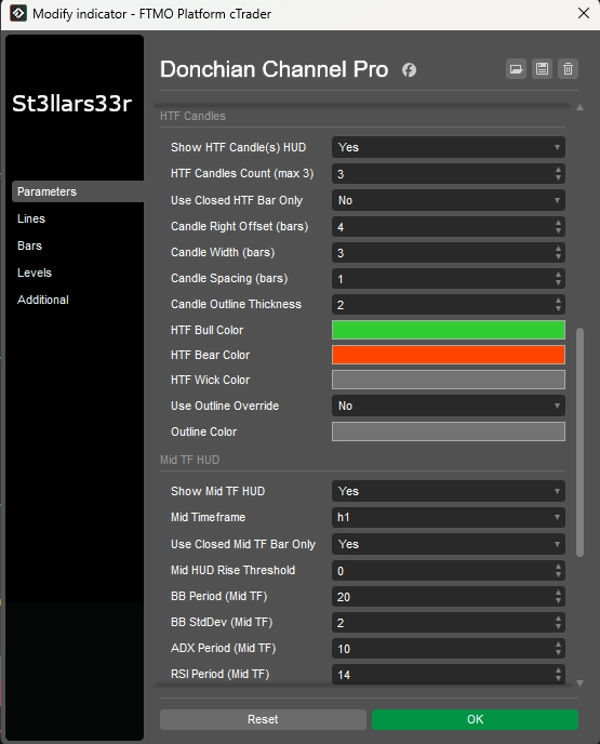
Gruppo: Candele HTF (Destra, Vicino all'Ultima Barra)
- Mostra HUD Candele HTF: Mostra le candele HTF a destra.
- Conteggio Candele HTF (max 3): Numero di candele HTF (1–3).
- Usa Solo Barra HTF Chiusa: Se vero, usa solo candele HTF chiuse (valori stabili). Se falso, include la candela aperta corrente.
- Offset Candela Destra (barre): Offset a destra in barre del TF corrente dall'ultima barra (ancora).
- Larghezza Candela (barre): Larghezza del rettangolo candela in barre del TF corrente.
- Spaziatura Candele (barre): Spazio tra le candele.
- Spessore Contorno Candela: Spessore dei contorni delle candele.
- Colore Bull HTF / Colore Bear HTF: Colori per candele rialziste/ribassiste.
- Colore Wick HTF: Colore per le ombre.
- Usa Sovrascrittura Contorno: Se vero, il corpo della candela è disegnato con un contorno (Colore Contorno) senza riempimento bull/bear.
- Colore Contorno: Colore per il contorno quando Usa Sovrascrittura Contorno = vero.
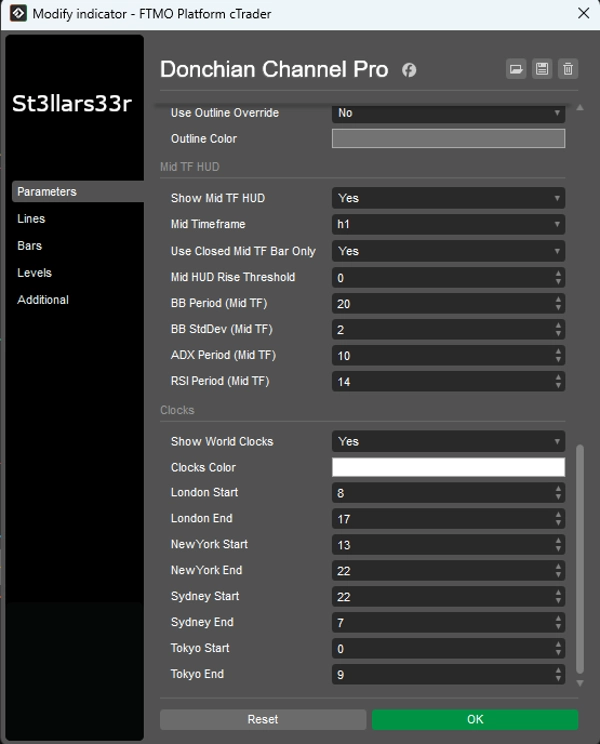
Gruppo: HUD TF Medio (In Basso a Destra)
- Mostra HUD TF Medio: Abilita HUD per il TF intermedio.
- Timeframe Medio: Seleziona TF intermedio (es. Minute15).
- Usa Solo Barra TF Medio Chiusa: Come HTF, ma per TF Medio.
- Soglia di Crescita HUD Medio: Sensibilità colore per HUD TF Medio.
- Periodo BB (TF Medio), Deviazione Std BB (TF Medio): Impostazioni Bande di Bollinger per TF Medio.
- Periodo ADX (TF Medio), Periodo RSI (TF Medio): Periodi ADX e RSI per TF Medio.
Gruppo: Orologi (In Basso al Centro)
- Mostra Orologi Mondiali: Mostra blocco con orologi e massimi/minimi sessione.
- Colore Orologi: Colore del testo per orologi/sessioni.
- Inizio Londra / Fine Londra: Ore di inizio/fine per la sessione di Londra.
- Inizio NewYork / Fine NewYork: Per New York.
- Inizio Sydney / Fine Sydney: Per Sydney.
- Inizio Tokyo / Fine Tokyo: Per Tokyo.
Orologi: Mostra l'ora locale reale per le città (tramite fusi orari OS con offset di fallback).
- I calcoli di attività sessione (e massimi/minimi) usano l'ora del server del broker (Server.Time). Se il server non è in UTC, le ore di sessione possono spostarsi—regola Inizio/Fine secondo necessità per il tuo server.
- Se una sessione attraversa la mezzanotte (Fine < Inizio), l'indicatore tiene automaticamente conto della transizione di data.
- Quando una sessione è inattiva, vengono mostrati i massimi/minimi dell'ultima sessione completata; quando inizia una nuova sessione, i dati si resettano e ricalcolano.
Riepilogo
Recensioni dei clienti
5 | 50 % | |
4 | 50 % | |
3 | 0 % | |
2 | 0 % | |
1 | 0 % |


