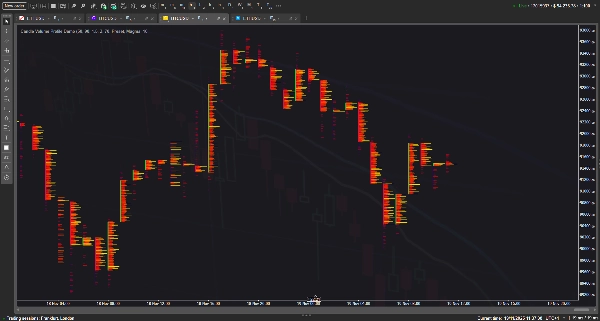
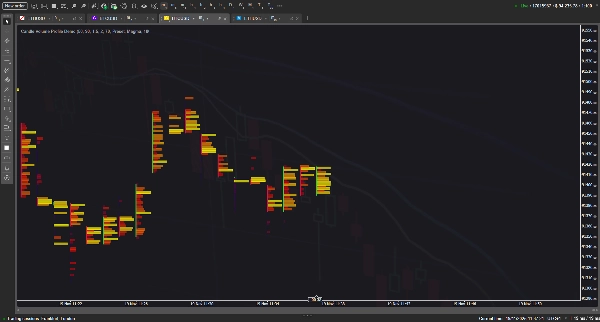
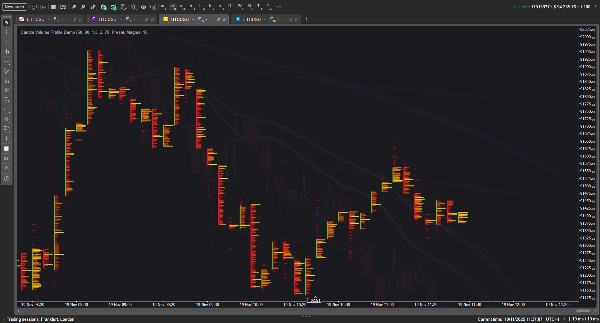
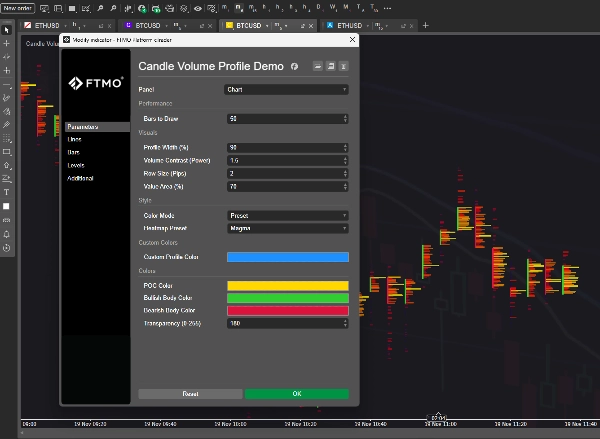
Candle Volume Profile Demo

4.0
19/11/2025
130
Desktop
Da 26/05/2025
Volume negoziato
321.89M
Profitto in pip
35.94K
Vendite
10
Installazioni gratuite
618


This indicator visualizes the Volume Profile for individual bars, transforming standard candlesticks into a detailed 'footprint' style chart with customizable heatmaps, Point of Control (POC) lines, and Value Area blocks to highlight volume distribution per price level. It aims to emulate professional order flow tools by using heuristic volume distribution to render market activity directly on the chart.
Theoretically, this concept should work seamlessly to provide deep market insights; however, in practice, due to the immense number of graphical objects required for rendering, the more features and history depth you demand from this indicator, the more it tends to lag and cause terminal instability. :(
4.0
Recensioni: 1
5 | 0 % | |
4 | 100 % | |
3 | 0 % | |
2 | 0 % | |
1 | 0 % |
Recensioni dei clienti
November 24, 2025
Candle Volume Profile Demo gives you a clean visual of volume distribution inside candles/ranges - a smart add-on for liquidity-aware traders. The visualization is sharp and performance solid, but as a demo version it lacks full features (history logs, advanced filters). Best when paired with structure and confirmation tools. A good starting point, ready to level up.
Altro da questo autore
Potrebbe interessarti anche
Indicatore
Breakout
3 Bar Triangle by Linda Raschke
3 bar triangle = high below 2 day high, low above 2 day low
Indicatore
Bollinger
E7 Indicators Free Studies
ADXR, KDJ, SineWave, Bollinger Band Volatility and AEOscillator.
Indicatore
Forex
Alert Positioner
Auto Fill Alert on all Ur Markings. **Easy to mark on multiple devices using Alerts' Position


![Logo di "[Stellar Strategies] Ultimate Trend & Momentum Dashboard"](https://market-prod-23f4d22-e289.s3.amazonaws.com/d8a894f3-34df-4f37-b4a3-c37e971e4e1f_cT_cs_4141285_NAS100_2025-06-24_17-12-20.png)


.png)