
Market Entropy
Indicatore
107 download
Versione 1.0, Aug 2025
Windows, Mac
Da 26/05/2025
388.58M
Volume negoziato
60.75K
Profitto in pip
15
Vendite
1.41K
Installazioni gratuite
Descrizione
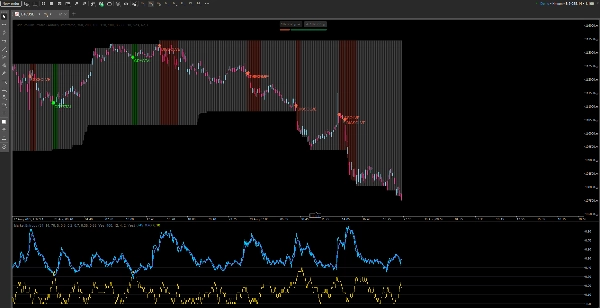
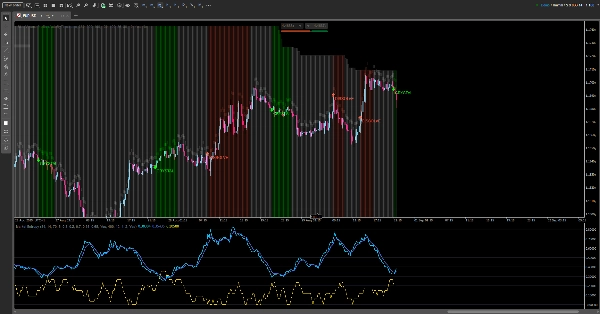
Market Entropy è un indicatore doppio (oscillatore + sovrapposizione prezzo opzionale) che quantifica l'organizzazione del mercato e segnala cambiamenti di regime attraverso Ordine → Transizione → Caos. Aggiunge una seconda linea, Trendness (DC), per separare vero trend da compressione di volatilità.
Come funziona:
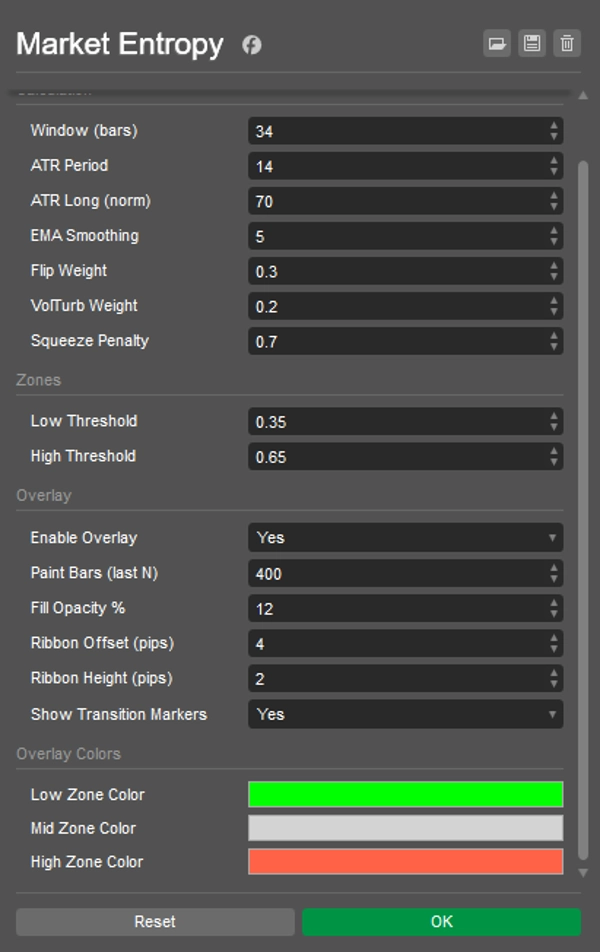
- Utilizza solo componenti OHLCV: DC (coerenza direzionale), FlipRate (inversioni di segno), Volatility_n (ATR/ATRlong), VolumeTurb (deviazione standard di ΔVolume).
- Entropia grezza:
E0 = 0.5*(1-DC) + 0.3*(FlipRate*VolN) + 0.2*VolumeTurb). - Il termine anti-compressione riduce E durante compressioni ATR → entropia finale ∈ [0..1] con smussamento EMA.
- Indicatori:
-
- CRYSTAL — incrocio sotto LowThr (emerge ordine: trend o compressione pre-rottura).
- DISSOLVE — incrocio sopra HighThr (l'ordine si rompe: decadimento caos/trend).
Cosa vedi:
- Nel pannello: Entropy, Entropy(EMA), Trendness (DC), soglie Low/High, sfondo della zona.
- Sul grafico (attivabile): barre colorate per stato, un sottile nastro sopra i massimi, e indicatori CRYSTAL/DISSOLVE.
Guida alla lettura:
- E < LowThr → Ordine:
-
- con alto DC → trend organizzato;
- con basso ATR → compressione (attesa rottura).
- LowThr…HighThr → Transizione: struttura in formazione; attendere risoluzione.
- E > HighThr → Caos: incertezza / esaurimento trend; evitare entrate di continuazione ingenue.
Playbook:
- Compressione → CRYSTAL → Rottura/Ritest — operare il breakout.
- Trend → DISSOLVE — ridurre la posizione o stringere il rischio.
Riepilogo
Profilo indicatore
Recensioni dei clienti
0.0
Recensioni: 0
Recensioni dei clienti
Questo prodotto non ha ancora ricevuto recensioni. L'hai già provato? Fallo sapere agli altri per primo!
Discussioni
Domande frequenti
I prodotti disponibili tramite cTrader Store, inclusi bot di trading, indicatori e plugin, sono forniti da sviluppatori terzi e resi disponibili esclusivamente a scopo informativo e di accesso tecnico. cTrader Store non è un broker e non fornisce consulenze in materia di investimento, raccomandazioni individualizzate o garanzie di risultati futuri.


Prezzo
Da 26/05/2025
388.58M
Volume negoziato
60.75K
Profitto in pip
15
Vendite
1.41K
Installazioni gratuite