
VolumeThermometer
Indikator
426 downloads
Version 1.0, Aug 2025
Windows, Mac
Seit 26/05/2025
449.3M
Gehandeltes Volumen
61.1K
Pip-Gewinn
15
Verkäufe
1.43K
Kostenlose Installationen
Beschreibung
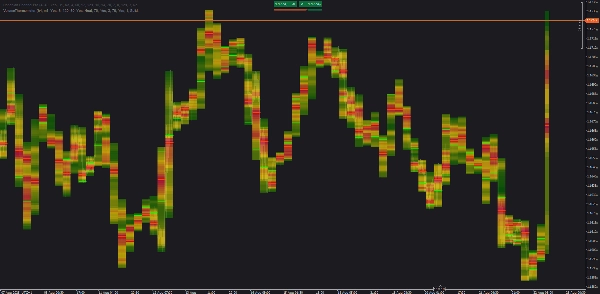
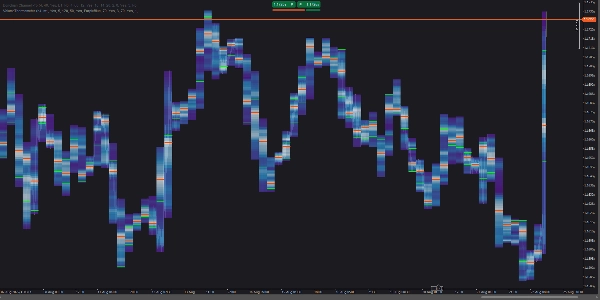
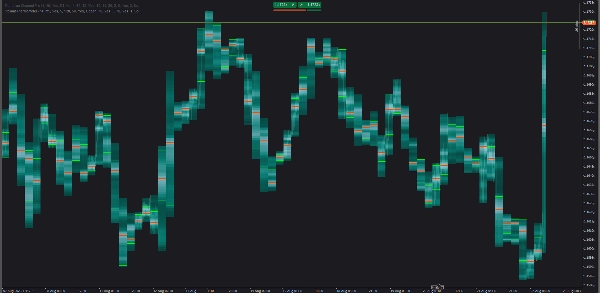
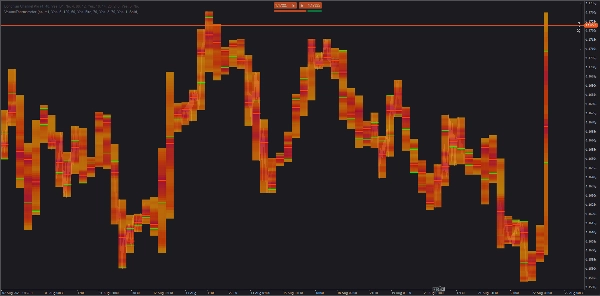
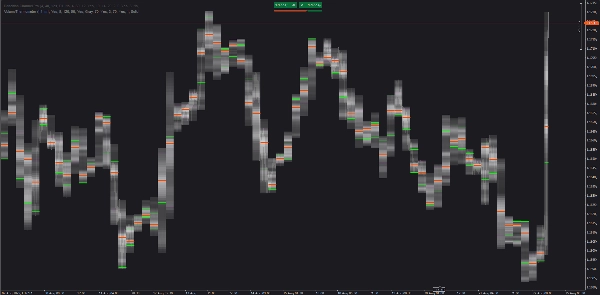
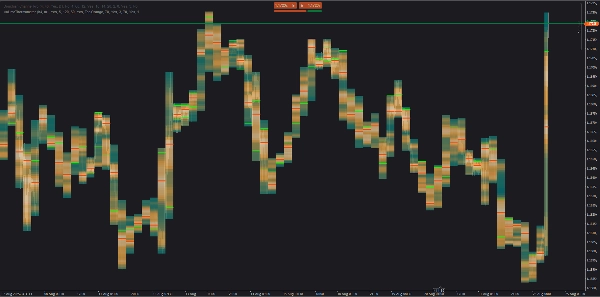
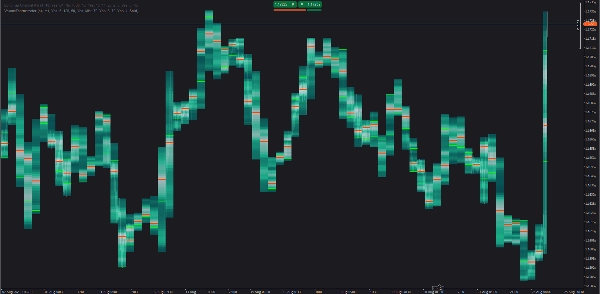
Eine cTrader-Heatmap, die zeigt, wie das Volumen innerhalb jeder HTF-Kerze verteilt ist. Sie verwendet LTF-Balken (z. B. M1), um vertikale Volumen-Bins zu erstellen, und zeichnet dann POC und Value Area (VA) Linien. Die aktuelle (unvollständige) HTF-Kerze wird in Echtzeit dargestellt.
Wie es funktioniert
- Aggregiert Tick-Volumen von LTF-Balken.
- Teilt jede HTF-Kerze in
BinsPreisabschnitte und weist Volumen nach Preisüberlappung zu. - Färbt Bins nach relativem Volumen; zeichnet POC, optionale VA Linien und kann diese nach rechts verlängern.
- Lädt ältere Historie nur für den sichtbaren Bereich automatisch nach (kleine Chargen).
Verwendung
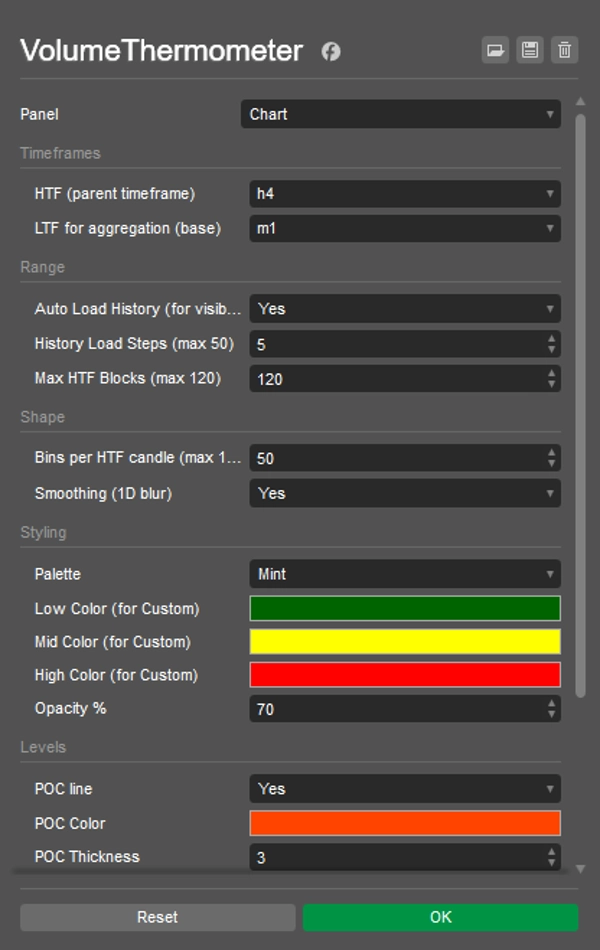
- Wähle HTF (z. B. H4) und LTF (z. B. M1).
- Aktiviere Auto Load History; scrolle/zoome zum gewünschten Bereich.
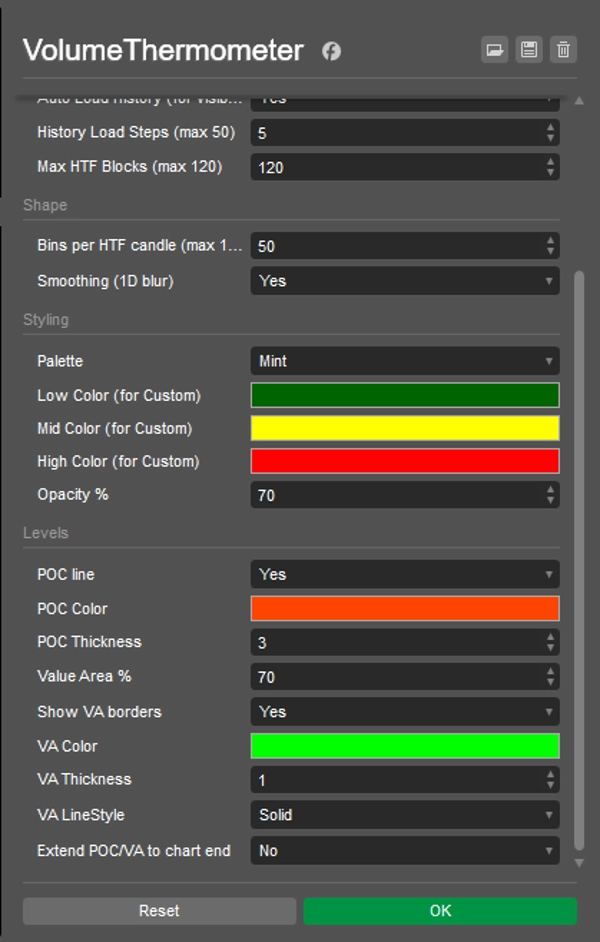
- Stelle Bins (Detail), Max HTF Blocks (Anzahl der anzuzeigenden Kerzen), Smoothing, Opacity und Farben ein.
- Beobachte POC/VA-Reaktionen und wie sich der POC von Kerze zu Kerze verschiebt.
Schnelle Ideen
- POC Retest: erster Kontakt mit dem vorherigen POC mit LTF-Bestätigung.
- VA Rotation: Wiedereinstieg in die VA zielt oft auf POC/anderen VA-Rand.
- LVN Durchgang: dünne (kalte) Bereiche neigen dazu, schnell zum nächsten Knoten zu wechseln.
Hinweise
- Verwendet Tick-Volumen (guter Proxy bei FX/CFD, nicht Börsenvolumen).
- Für bessere Leistung reduziere bei Bedarf Bins oder Max HTF Blocks.
Zusammenfassung
KI-Zusammenfassung
VolumeThermometer is a cTrader indicator that visualizes intra-higher timeframe (HTF) volume distribution using a heatmap. It aggregates tick volume data from lower timeframe (LTF) bars (e.g., M1) to construct vertical volume bins within each HTF candle (e.g., H4). The indicator highlights the Point of Control (POC) and Value Area (VA) lines, showing where the most volume is concentrated by price level. The current HTF candle is updated in real time, and the indicator automatically loads historical data for the visible chart range in small batches to optimize performance.
Key features include:
- Aggregation of tick volume from LTF bars.
- Division of HTF candles into price bins with volume assigned by price overlap.
- Color-coded volume bins indicating relative volume intensity.
- Display of POC and optional VA lines, with the ability to extend these lines forward.
- Customizable settings for bin detail, maximum HTF candles displayed, smoothing, opacity, and colors.
- Supports multiple markets including Forex, indices, commodities, stocks, and cryptocurrencies such as BTCUSD and EURUSD.
Users can monitor POC retests, VA rotations, and low volume node pass-throughs to analyze volume behavior within HTF candles. The indicator uses tick volume as a proxy, suitable for FX and CFD markets.
Indikatorprofil
Kundenbewertungen
0.0
Bewertungen: 0
Kundenbewertungen
Bisher gibt es keine Bewertungen für dieses Produkt. Haben Sie es schon ausprobiert? Dann können Sie die erste Person sein, die andere darüber informiert!
Diskussion
Häufig gestellte Fragen (FAQ)
BTCUSD
Prop
Forex
Indices
EURUSD
Commodities
Crypto
Stocks
NAS100
Über den cTrader Store verfügbare Produkte, einschließlich Handelsbots, Indikatoren und Plugins, werden von externen Entwicklern bereitgestellt und nur zu Informations- und technischen Zugriffszwecken verfügbar gemacht. cTrader Store ist kein Broker und erbringt keine Anlageberatung, persönlichen Empfehlungen oder eine Garantie für zukünftige Performance.


Preis
Seit 26/05/2025
449.3M
Gehandeltes Volumen
61.1K
Pip-Gewinn
15
Verkäufe
1.43K
Kostenlose Installationen