
CursorByte.SupportResistance v3
Indicatore
292 download
Versione 1.0, Mar 2025
Windows, Mac
5.0
Recensioni: 1
Descrizione
***Versione migliorata***
https://ctrader.com/products/2113
***********************
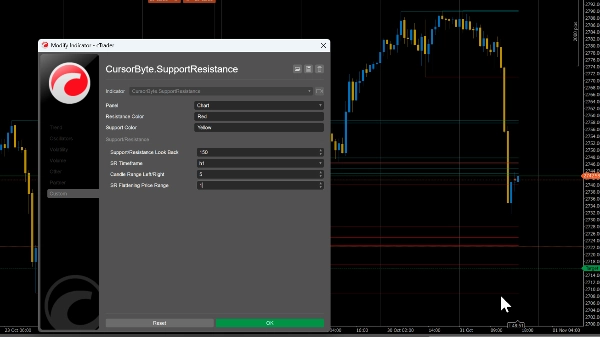
Puoi impostare l'intervallo di appiattimento del prezzo in base alla coppia. Puoi usare 0.0001 per coppie come GU e 1.5 per l'Oro.
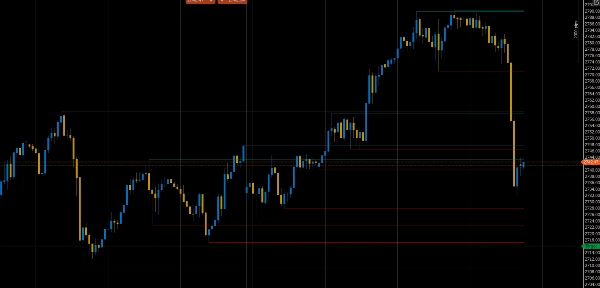
Questo indicatore identifica automaticamente i livelli chiave di supporto e resistenza sul grafico, aiutando i trader a individuare potenziali zone di inversione, punti di rottura e aree di consolidamento del prezzo per decisioni migliori di entrata e uscita.
NB: Usa l'intervallo di appiattimento del prezzo per ridurre il disordine sul grafico (consolida le linee SR all'interno di un particolare intervallo di prezzo in una sola).
Riepilogo
Profilo indicatore
Recensioni dei clienti
5.0
Recensioni: 1
5 | 100 % | |
4 | 0 % | |
3 | 0 % | |
2 | 0 % | |
1 | 0 % |
Recensioni dei clienti
August 12, 2025
Pros: Accurate auto SR levels, customizable design, stable performance. Cons: No significance filter, no auto-clear, possible chart clutter.
Discussioni
Domande frequenti
Breakout
Commodities
XAUUSD
I prodotti disponibili tramite cTrader Store, inclusi bot di trading, indicatori e plugin, sono forniti da sviluppatori terzi e resi disponibili esclusivamente a scopo informativo e di accesso tecnico. cTrader Store non è un broker e non fornisce consulenze in materia di investimento, raccomandazioni individualizzate o garanzie di risultati futuri.


Prezzo
Da 31/10/2024
56
Vendite
1.75K
Installazioni gratuite