
📊 Cruscotto Gamma Pip Giornaliera (Strumento ADR Allineato alla Sessione)
Il Cruscotto Gamma Pip Giornaliera è un'utilità professionale per il trading che mostra statistiche in tempo reale sulla gamma giornaliera direttamente sul tuo grafico — completamente allineato alla sessione UTC del tuo broker.
Progettato per trader di precisione, questo strumento calcola la gamma pip High-Low utilizzando veri confini giornalieri basati sulla sessione e fornisce potenti statistiche mobili per il contesto di mercato e l'analisi della volatilità.
🔥 Caratteristiche Principali
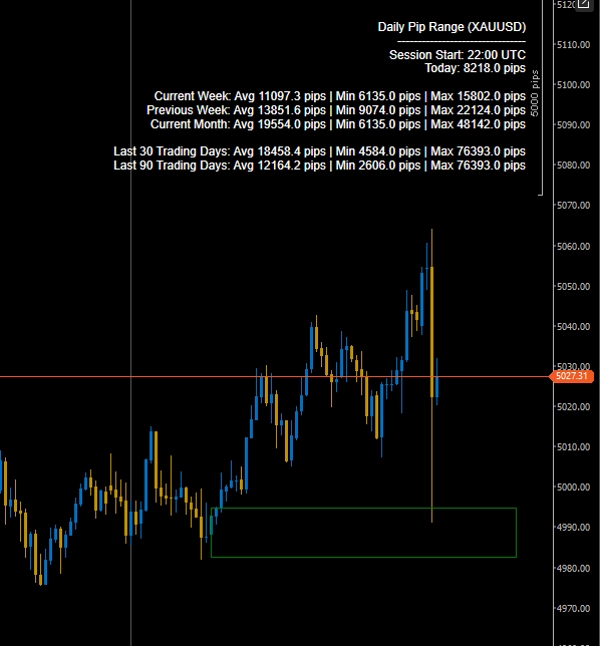
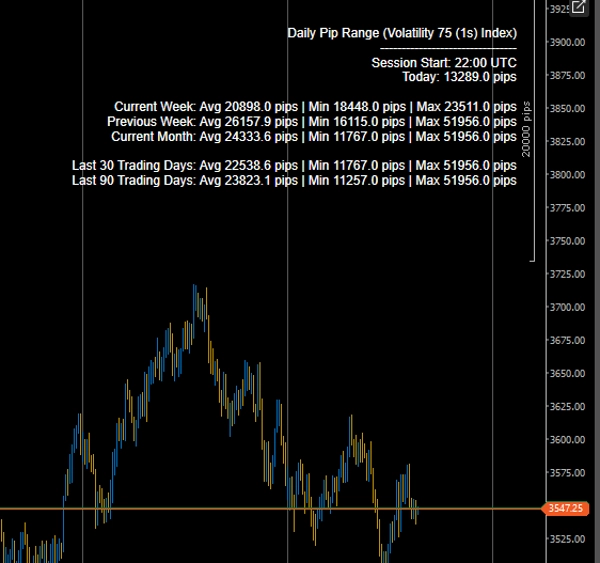
✅ Gamma Giornaliera Live di Oggi (High–Low in Pips)
Visualizza l'aggiornamento in tempo reale della gamma pip della sessione corrente.
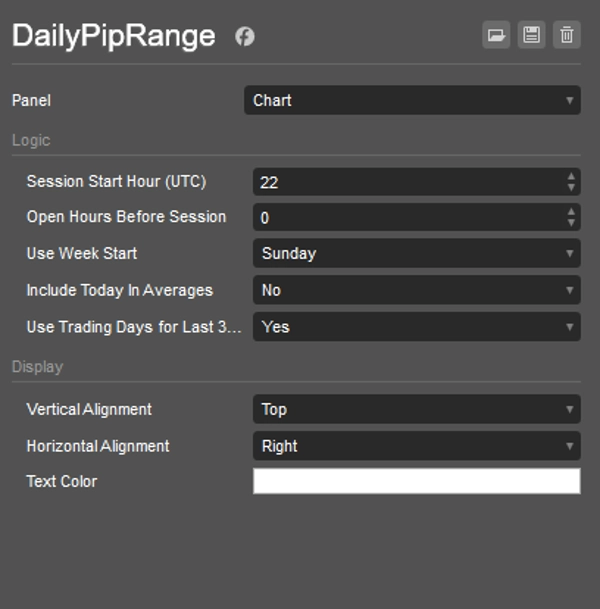
✅ Calcoli Allineati alla Sessione (Controllo UTC)
Definisci:
- Ora di Inizio Sessione (UTC)
- Ore di Apertura Prima della Sessione
Questo garantisce che le tue statistiche giornaliere corrispondano alla giornata di trading del tuo broker — ideale per l'allineamento alla chiusura di NY e per analisi in stile istituzionale.
✅ Analisi Statistica Avanzata
Per ogni periodo, l'indicatore mostra:
- Gamma Giornaliera Media
- Gamma Giornaliera Minima
- Gamma Giornaliera Massima
Periodi inclusi:
- Settimana Corrente
- Settimana Precedente
- Mese Corrente
- Ultimi 30 Giorni
- Ultimi 90 Giorni
✅ Commutatore Giorni di Trading o Giorni di Calendario
Scegli tra:
- Ultimi 30/90 giorni di calendario
- Ultimi 30/90 giorni di trading (solo barre giornaliere)
Perfetto per filtrare i fine settimana e le pause non di trading.
✅ Visualizzazione Personalizzabile
- Posizione dello schermo regolabile (in alto a destra, ecc.)
- Personalizzazione del colore del testo
- Overlay leggero e non invasivo
🎯 Perché Usare Questo Strumento?
- Identificare l'espansione e la contrazione della volatilità
- Confrontare la gamma di oggi con le medie storiche
- Individuare la compressione prima delle rotture
- Filtrare le operazioni basate sul contesto ADR
- Migliorare la dimensione del rischio basata sulle condizioni di volatilità
Che tu faccia trading intraday, swing o sull'oro, questo strumento ti offre un'intelligenza immediata sulla volatilità senza ingombri.
⚙️ Ideale Per
- Trader Forex
- Trader Oro (XAUUSD)
- Trader Indici
- Sistemi Basati sulla Volatilità
- Trader di Rottura
- Analisi della gamma in stile istituzionale
🚀 Consapevolezza Professionale della Volatilità - Direttamente Sul Tuo Grafico
Progettato per prestazioni, precisione e accuratezza della sessione.
5 | 50 % | |
4 | 50 % | |
3 | 0 % | |
2 | 0 % | |
1 | 0 % |


![Logo di "[Stellar Strategies] Market Session Ultimate"](https://cdn.ctrader.com/image/webp/61ffd537-0125-4246-9e72-42eca1791d64_28232)


