
Açıklama
Pinescriptlabs Store göstergeleri: 🤖Pinescriptlabs Store cBots:
SmartTrend Destek & Direnç Çizgileri Altın & BTC Kırılma Seansı Pivotları(yeni) YieldShield" 🛡️
Dinamik Piyasa Yapısı
Dönüş Noktalarının Analizi
Fibonacci Lineer
Regresyon Çok Zamanlı Çerçeve
Çok Seviyeli Mum Eğilimi
Takipçi
Otomatik Destek ve
Direnç Trend Çizgileri
Tüm Destek ve
Direnç Seviyeleri
ICT ÜÇLÜ GÜÇ ⚡📊
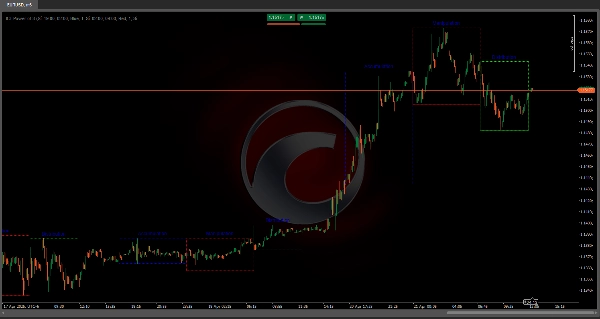
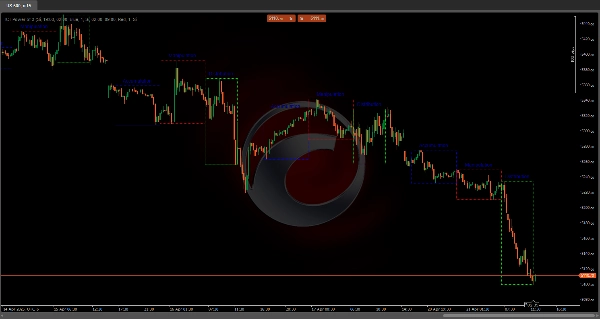
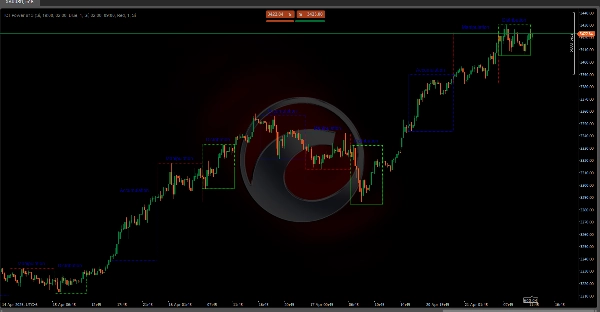
Bu gösterge, ICT "Üçlü Güç" teorisini otomatikleştirir ve grafiğinizde üç ana piyasa bölgesini çizer—Biriktirme, Manipülasyon ve Dağıtım—hem saf seansları hem de örtüşmelerini yakalayan hassas zaman dilimleri kullanarak. Sonuç, büyük oyuncuların destekleri belirlediği, stopları avladığı ve trendleri yönlendirdiği yerleri gösteren görsel bir "harita" 🗺️—manuel mum veya fitil analizi gerektirmez!
Bu Algoritmanın Ticarette Önemi 💡
Kurumsal Görünürlük 👀: "Akıllı Para"nın biriktiği, manipüle ettiği ve dağıttığı bölgelerin tespiti otomatikleştirilerek tahmin yürütme ortadan kalkar ve gerçek likiditenin nerede aktığını anında görürsünüz.
Tuzak & Likidite Tespiti 🎯: Manipülasyon aşaması (Avrupa-NY örtüşmesi), stop avlarının gerçekleştiği yerdir—bunları tespit etmek, daha düşük riskle işlem yapmanızı sağlar.
Trend Onayı 🚀: Saf NY Dağıtım bölgesi, yönlü momentumun özünü yakalar—bu yönde işlem yapmak başarı oranlarını artırır.
Tutarlılık 🔄: Sabit zaman dilimleri ve standart görseller kullanmak duygusal önyargıyı ortadan kaldırır ve geriye dönük testleri kolaylaştırır.
Üç Aşamanın Tespiti (Örtüşme Odaklı) 🔍
1️⃣ Biriktirme (Asya + Tokyo/Londra Örtüşmesi: 19:00 – 02:00 EST)
- Başlangıç ⏳: İlk 19:00 EST mumunda, başlangıç yüksek/düşüğü yakalayan bir "kutu" açılır.
- Takip 🔄: Fiyat aralığı kırarsa (yeni yüksek/düşük), kutu gerçek zamanlı olarak genişler.
- Kapanış 🚪: 02:00 EST'de kutu kilitlenir ve Akıllı Paranın düşük volatilite ile emirleri emdiği yer işaretlenir.
2️⃣ Manipülasyon (Avrupa + Londra/NY Örtüşmesi: 02:00 – 09:00 EST)
- Başlangıç ⏳: İlk 02:00 EST mumunda tespit edilir.
- Davranış 🎭: Önceki ekstremlerin sahte kırılmalarını vurgular—her reddediş görsel olarak takip edilir.
- Kapanış 🚪: 09:00 EST'de sona erer ve stop avlarının yoğunlaştığı yerleri ortaya çıkarır.
3️⃣ Dağıtım (Saf NY Seansı: 09:00 – 14:00 EST)
- Başlangıç ⏳: 09:00 EST mumuyla başlar.
- Gelişim 📈: Kutu, en güçlü trendle büyür—kurumların pozisyonları serbest bıraktığı yer.
- Kapanış 🚪: 14:00 EST'de tamamlanır ve en yüksek momentum & hacim aşamasını işaretler.
Gün Yönetimi & Otomatik Temizlik 🧹
Grafik karmaşasını önlemek için gösterge sadece son N günü (ayarlanabilir) tutar. Bu sınır aşıldığında, eski bölgeleri—sınırlar, dolgu ve etiketler—otomatik olarak siler ve analizinizin temiz & odaklı kalmasını sağlar.
Özet
The indicator identifies:
1. Accumulation phase (7 PM – 2 AM EST, Asia + Tokyo/London overlap), marking where smart money absorbs orders with low volatility.
2. Manipulation phase (2 AM – 9 AM EST, Europe + London/New York overlap), highlighting false breakouts and stop hunts.
3. Distribution phase (9 AM – 2 PM EST, pure New York session), showing where institutions release positions during the highest momentum and volume.
ICT Power of 3 enhances trading by providing institutional visibility, trap and liquidity detection, and trend confirmation. It uses fixed timeframes and standardized visuals to reduce emotional bias and simplify backtesting. The indicator also manages chart clutter by automatically deleting old zones beyond a configurable number of days, keeping the analysis focused on recent data. It supports markets including commodities, cryptocurrencies (BTC, ETH), and symbols like BTCUSD and XAUUSD.
Müşteri değerlendirmeleri
5 | 100 % | |
4 | 0 % | |
3 | 0 % | |
2 | 0 % | |
1 | 0 % |


