
SupertrendHTF
Indikator
Versi 1.0, Jul 2025
Windows, Mac
5.0
Ulasan: 1
Penerangan
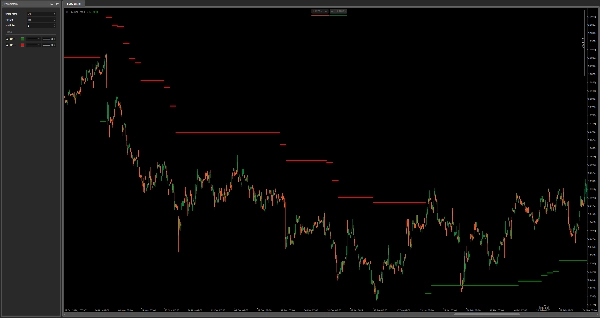
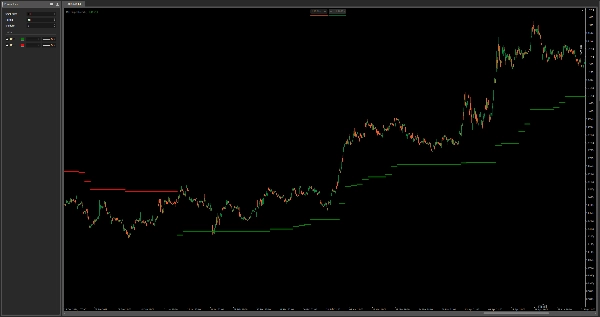
HTF SuperTrend – Ikuti Tren dengan Ketepatan Masa Bingkai Lebih Tinggi
Penunjuk ini meletakkan SuperTrend dari masa bingkai yang lebih tinggi ke carta semasa anda, membolehkan anda berdagang dengan gambaran yang lebih besar—sesuai untuk menapis bunyi dan kekal di sisi momentum yang betul.
Ciri-ciri:
- Melakar SuperTrend dari mana-mana masa bingkai yang boleh dipilih lebih tinggi
- Bertindak sebagai sokongan/rintangan dinamik dan penapis tren
- Sesuai untuk mengelakkan isyarat palsu pada masa bingkai yang lebih rendah
- Berfungsi merentasi semua aset dan masa bingkai
Gunakan ia untuk mengesahkan kemasukan, mengekalkan perdagangan lebih lama, atau sekadar tidak melawan tren.
Ringkasan
Ringkasan AI
SupertrendHTF is a trading indicator that overlays the SuperTrend from a higher timeframe onto the current chart. This approach helps traders filter out market noise and avoid false signals commonly seen on lower timeframes by providing a clearer view of the prevailing trend. Key features include the ability to select any higher timeframe for the SuperTrend plot, use as dynamic support and resistance levels, and serve as a trend filter. It is compatible with all asset types and timeframes, making it versatile for various trading strategies. Traders can use SupertrendHTF to confirm entry points, maintain positions longer, or align trades with the dominant market momentum.
Profil indikator
Ulasan pelanggan
5.0
Ulasan: 1
5 | 100 % | |
4 | 0 % | |
3 | 0 % | |
2 | 0 % | |
1 | 0 % |
Perbincangan
Soalan Lazim
Produk yang tersedia melalui cTrader Store, termasuk bot dagangan, indikator dan plugin, disediakan oleh pembangun pihak ketiga dan diberikan akses untuk tujuan maklumat dan teknikal sahaja. cTrader Store bukan broker dan tidak memberikan nasihat pelaburan, syor peribadi atau sebarang jaminan prestasi masa hadapan.


Harga
Sejak 03/01/2025
638.03K
Volum yang didagangkan
21.34K
Pip dimenangi
15
Jualan