
Opis
Wskaźniki Pinescriptlabs Store: 🤖Pinescriptlabs Store cBoty : (cBot)
Gold & BTC BreakoutSession Pivots(nowy)
SmartTrend Support &
Resistance
Lines
Dynamic
Market Structure
Analysis
of
Turning Points
Fibonacci
Linear
Regression
Multi-timeframe
Multi-Level
Candle Bias
Tracker
Auto
Support and
Resistance
Trend
Lines
All
Support and
Resistance
Levels
The Z-Score przekształca cenę w "skalę odchylenia standardowego"
dewiacji standardowej",
pokazując, jak bardzo zamknięcie każdej świecy (lub otwarcie, maksimum, minimum) odbiega od jej
historycznej średniej. Dzięki intuicyjnej wizualizacji pomaga zidentyfikować warunki wykupienia/wyprzedania
oraz strefy wysokiego prawdopodobieństwa odwrócenia! 🔄
1️⃣ Co to robi?
🔹 Standaryzuje cenę: Konwertuje bezwzględną wartość zamknięcia na Z-Score—ile odchyleń standardowych jest od średniej
ostatnich N świec.
🔹 Podkreśla
ekstrema statystyczne: Wartości
bliskie ±1, ±2 lub ±3 wskazują na rzadkość ruchu cenowego:
- ±1 SD (≈ 68% prawdopodobieństwa między –1 a 1)
- ±2 SD (≈ 95% prawdopodobieństwa między –2 a 2)
- ±3 SD (≈ 99,7% prawdopodobieństwa między –3 a 3)
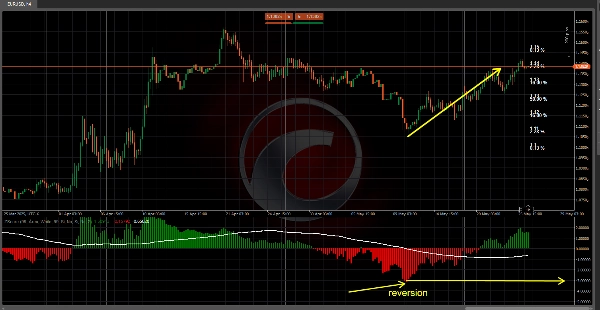
🔹 Pomaga
w handlu odwróceniem do średniej:
Gdy Z-Score przekracza ±2 lub ±3, rynek znajduje się w ekstremalnej
strefie i ma tendencję do
powrotu do średniej (zera).
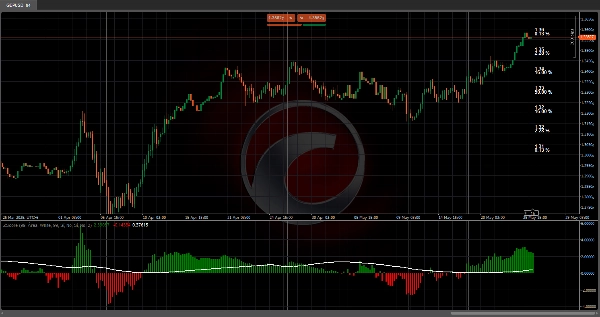
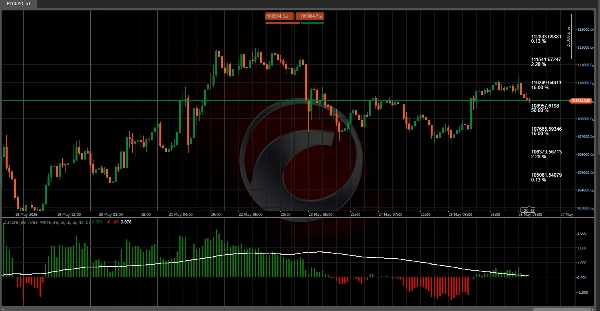
🔹 Wyraźna
wizualizacja: Za pomocą histogramów (lub specjalnych świec), linii średniej kroczącej
oraz kolorowych stref, można natychmiast zobaczyć, czy cena zachowuje się "normalnie" czy jest statystycznym
odstającym punktem.
2️⃣ Jak to działa?
📐 Obliczanie średniej i odchylenia standardowego
- Używany jest
okres cofnięcia (np. 99
świec). - Obliczana jest średnia oraz odchylenie standardowe (SD)
wartości zamknięcia. - Wyższe SD = większa zmienność w ruchach cen.
🧮 Wzór na Z-Score
Z=Current Close−Historical MeanStandard DeviationZ=Standard DeviationCurrent Close−Historical Mean
- Dodatni Z → Zamknięcie powyżej średniej.
- Ujemny Z → Zamknięcie poniżej średniej.
📊 Prawdopodobieństwa w tabeli Z
- Podświetla kolumnę aktualnego Z-Score, aby pokazać jak rzadkie/ekstremalne jest zachowanie ceny!
3️⃣ Jak używać tego w handlu
✅ Handel odwróceniem do średniej: Szukaj Z > +2 lub Z < –2 do handlu odwróceniami (sprzedawaj wykupione
ekstrema, kupuj wyprzedane ekstrema).
✅ Potwierdzenie trendu: Utrzymujący się Z
> 0 + rosnąca średnia krocząca sygnalizuje
siłę; Z < 0 + opadająca MA sugeruje słabość.
✅ Zarządzanie ryzykiem: Blisko ±1 SD, oczekuj normalnych ruchów; blisko ±3
SD, ostrożnie dostosuj stop lossy i wielkość pozycji.
✅ Timing wejścia: Połącz ekstremalne Z-Score z poziomami wsparcia/oporu
dla precyzyjnych wejść.
4️⃣ Zalety i uwagi
✔️ Zalety
- Statystyczna przewaga w wykrywaniu ekstremalnych warunków cenowych.
- Wiele trybów wyświetlania (histogram, świece, pasma, tabela prawdopodobieństwa).
- Łatwa personalizacja (długość, kolory, typ wykresu).
⚠️ Uwagi:
- W mocnych
trendach cena może pozostawać
"ekstremalna" przez długi czas bez odwrócenia. - Zakłada normalny
rozkład—może nie działać dobrze na bardzo zmiennych/przekrzywionych rynkach. - Najlepiej stosować w stabilnych
środowiskach zmienności.
Podsumowanie
The indicator calculates the mean and standard deviation of recent closing prices to determine the Z-Score using the formula:
Z = (Current Close − Historical Mean) / Standard Deviation.
Positive Z-Scores indicate prices above the mean, while negative scores indicate prices below it.
ZScore Reversion provides clear visualizations through histograms, special candles, moving averages, and colored zones to distinguish normal price behavior from statistical outliers. It supports mean reversion trading by signaling when prices exceed ±2 or ±3 standard deviations, suggesting a likely return to the mean. It also aids trend confirmation by interpreting sustained positive or negative Z-Scores combined with moving average trends.
Risk management is facilitated by adjusting stops and position sizes near extreme Z-Score values. Entry timing can be refined by combining extreme Z-Scores with support and resistance levels. The indicator offers multiple display modes and customization options for length, colors, and chart types. It is best suited for stable volatility environments and assumes a normal distribution of price data.
Opinie klientów
5 | 100 % | |
4 | 0 % | |
3 | 0 % | |
2 | 0 % | |
1 | 0 % |


