

DailyTargets
Indikator
223 downloads
Version 1.0, May 2026
Windows, Mac
5.0
Bewertungen: 2
Seit 21/02/2025
466.3M
Gehandeltes Volumen
180.83K
Pip-Gewinn
26
Verkäufe
7.43K
Kostenlose Installationen
Beschreibung
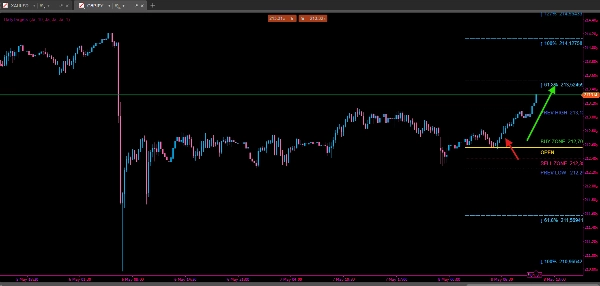
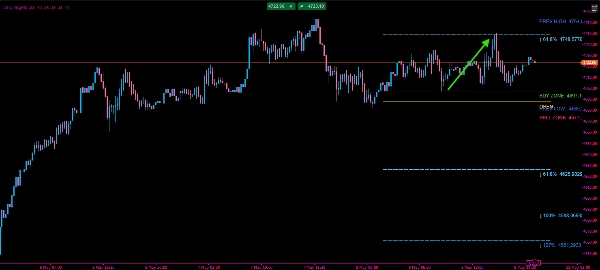
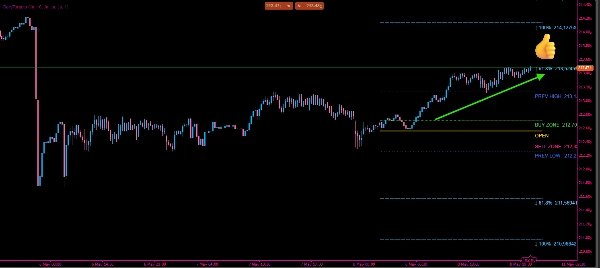
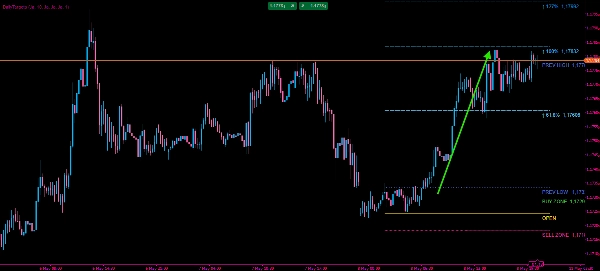
Verbessern Sie Ihre tägliche Handelspräzision mit DailyTargets, einem umfassenden Overlay-Indikator, der entwickelt wurde, um wichtige institutionelle Niveaus und volatilitätsbasierte Ziele hervorzuheben. Durch die Nutzung eines Multi-Perioden Average Daily Range (ADR) bietet dieses Tool eine klare Roadmap für jede Handelssitzung.
Hauptmerkmale:
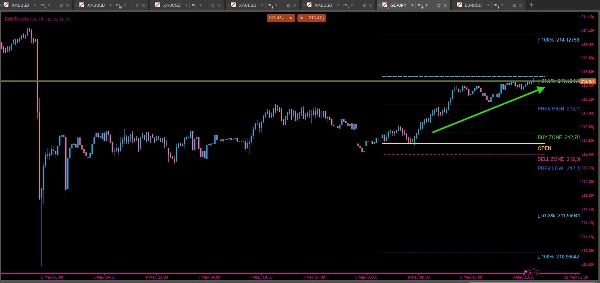
- Dynamische Kauf-/Verkaufszonen: Berechnet automatisch Einstiegszonen basierend auf einem Prozentsatz der täglichen Volatilität ab Markteröffnung.
- Volatilitätsziele: Zeichnet klare Gewinnmitnahme-Niveaus basierend auf Fibonacci- und Standard-ADR-Verhältnissen (61,8 %, 100 %, 127 %, 161 % und 200 %).
- Marktkontext: Zeigt die Hoch- und Tiefststände des Vortages an, um potenzielle Ausbruchs- oder Umkehrpunkte zu identifizieren.
- Echtzeit-Benachrichtigungen: Bleiben Sie informiert mit sofortigen Benachrichtigungen, wenn der Preis die tägliche Eröffnung überschreitet, was auf eine mögliche Änderung des Intraday-Trends hinweist.
- Vollständig anpassbar: Passen Sie Linienbreiten, -stile und die Sichtbarkeit einzelner Komponenten an, um Ihre persönliche Chartvorlage zu entsprechen.
Technische Logik: Der Indikator berechnet einen gewichteten Durchschnitt des ADR (1, 5, 10 und 20 Perioden), um eine geglättete, aber dennoch reaktionsfähige Volatilitätsmessung zu bieten. Dies stellt sicher, dass Ihre Ziele sich an die aktuellen Marktbedingungen anpassen, egal ob der Markt trendet oder konsolidiert.
Zusammenfassung
AI summary
DailyTargets is a trading indicator that overlays dynamic, volatility-based levels and targets on price charts. It calculates a weighted average of the Average Daily Range (ADR) across multiple periods (1, 5, 10, and 20) to provide smoothed, adaptive volatility measurements. Key features include automatically generated Buy and Sell zones based on a percentage of daily volatility from the market open, and plotted profit-taking targets using Fibonacci and standard ADR ratios (61.8%, 100%, 127%, 161%, and 200%). The indicator also displays the previous day's High and Low levels to help identify potential breakout or reversal points. Real-time alerts notify users when the price crosses the daily open, signaling possible intraday trend shifts. Users can customize line widths, styles, and visibility of individual components to fit their chart preferences. DailyTargets supports visualization of key institutional levels and volatility targets to assist traders in planning entries, exits, and managing intraday market context.
Indikatorprofil
Indikatorkategorie
Unterstützung und Widerstand
Ausgabetyp
Visualisierung
Datenanforderungen
Nur Balken
Unterstützte Signale
Ausbruch
Level – Durchbrechen
Level – Berührung
Eröffnungsspanne der Sitzung
Kundenbewertungen
5.0
Bewertungen: 2
5 | 100 % | |
4 | 0 % | |
3 | 0 % | |
2 | 0 % | |
1 | 0 % |
Kundenbewertungen
September 10, 2026
DailyTargets is a practical ADR-based overlay that clearly displays the daily open, Buy/Sell zones, previous-day High/Low and 61.8–200% volatility targets. Testing on EURUSD and XAUUSD showed clean intraday rendering and good M1/H1 consistency. The main limitations were reduced readability on very high timeframes and an unusual D1 display state that deserves clarification. Alerts and the exact weighted ADR formula were not independently verified, but the core visual functionality performed well.
May 27, 2026
The setup is straightforward and it integrates smoothly into my existing chart layout. It works well across different timeframes and asset classes, which makes it very versatile.
Diskussion
Häufig gestellte Fragen (FAQ)
Fibonacci
Key Levels
Über den cTrader Store verfügbare Produkte, einschließlich Handelsbots, Indikatoren und Plugins, werden von externen Entwicklern bereitgestellt und nur zu Informations- und technischen Zugriffszwecken verfügbar gemacht. cTrader Store ist kein Broker und erbringt keine Anlageberatung, persönlichen Empfehlungen oder eine Garantie für zukünftige Performance.
















![„[Stellar Strategies] Smart ADX“-Logo](https://cdn.ctrader.com/image/webp/af13b084-b6f6-41db-b7bc-c7e688b57b05_36929)











Preis
Seit 21/02/2025
466.3M
Gehandeltes Volumen
180.83K
Pip-Gewinn
26
Verkäufe
7.43K
Kostenlose Installationen