KasePeakOscillator
Indikator
45 unduhan
Versi 1.0, May 2026
Windows, Mac
5.0
Ulasan: 1
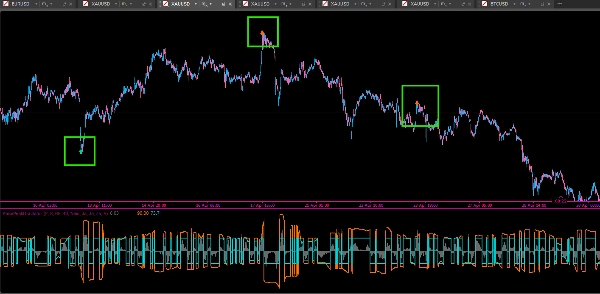
Trading product for KasePeakOscillator Indikator Key Levels Volume, image 2
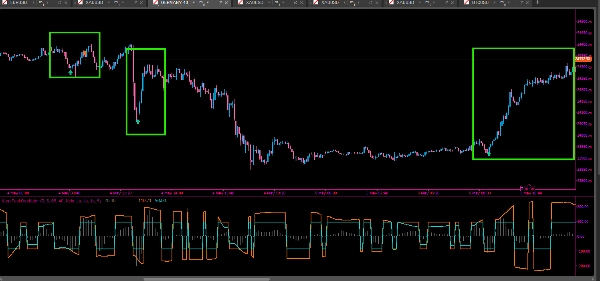
Trading product for KasePeakOscillator Indikator Key Levels Volume, image 3
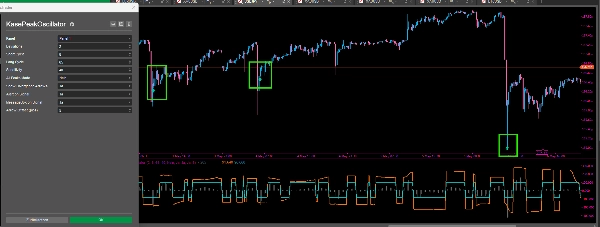
Trading product for KasePeakOscillator Indikator Key Levels Volume, image 4
Sejak 21/02/2025
466.3M
Volume trading
180.83K
Pip dimenangkan
22
Penjualan
6.87K
Instal gratis

Deskripsi

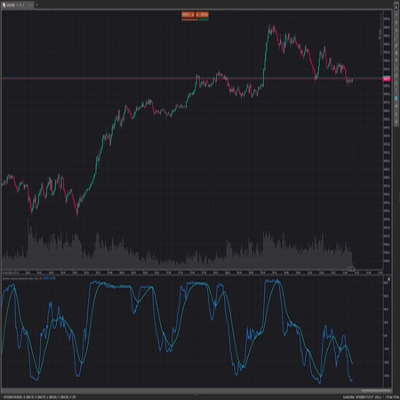
The KasePeakOscillator (KPO) adalah alat analisis teknis canggih yang dirancang untuk mengidentifikasi kelelahan pasar, pembalikan tren, dan pergeseran momentum. Berbeda dengan osilator standar, KPO mengintegrasikan ukuran volatilitas statistik untuk memberikan sinyal yang lebih dapat diandalkan dalam kondisi pasar yang bervariasi.

Cara Kerjanya: Indikator menghitung hubungan antara aksi harga dan volatilitas historis (Average Daily Range/Standard Deviation). Ini mengevaluasi "Siklus Pendek" terhadap "Siklus Panjang" untuk menentukan apakah pergerakan harga secara statistik signifikan atau hanya kebisingan pasar. Hasilnya adalah osilator yang halus dan responsif yang berosilasi di sekitar garis nol.

Komponen Utama:

  • Histogram (KCD): Mewakili momentum inti. Persilangan garis nol menunjukkan perubahan bias tren jangka pendek.
  • Pita Dinamis (Atas/Tengah): Ini berfungsi sebagai ambang "overbought" dan "oversold" statistik. Mereka menyesuaikan dengan volatilitas pasar, melebar selama periode aktivitas tinggi dan menyempit selama konsolidasi.
  • Deteksi Puncak Otomatis: Indikator mengidentifikasi "Puncak" dan "Lembah" di mana momentum mencapai ekstrem statistik, menandakan potensi kelelahan.

Strategi Perdagangan:

  1. Kelelahan Puncak: Ketika puncak momentum terjadi di luar pita dinamis (ditandai dengan panah Mint atau Oranye), ini menunjukkan tren saat ini terlalu diperpanjang dan kemungkinan pembalikan atau koreksi.
  2. Sinyal Divergensi: KPO secara otomatis mengidentifikasi Divergensi Bullish dan Bearish. Divergensi terjadi ketika harga membuat ekstrem baru tetapi osilator gagal melakukannya, menunjukkan melemahnya momentum. Ini ditandai dengan Light Blue (Bullish) dan Gold (Bearish) ikon.
  3. Konfirmasi Tren: Gunakan posisi Histogram relatif terhadap garis nol untuk mengonfirmasi arah tren. Tetap di atas nol mendukung posisi beli, sementara tetap di bawah nol mendukung posisi jual.

Fitur:

  • Sistem Peringatan Terintegrasi (Suara, Kotak Pesan, dan Ikon Visual).
  • Sensitivitas yang Dapat Disesuaikan untuk menyesuaikan dengan berbagai kelas aset (Forex, Indeks, Kripto).
  • "Mode Semua Puncak" untuk scalping agresif atau mode tersaring untuk setup swing dengan probabilitas tinggi.

Ringkasan

Ringkasan AI
The KasePeakOscillator (KPO) is a technical indicator designed to detect market exhaustion, trend reversals, and momentum shifts by integrating price action with statistical volatility measures. It calculates the relationship between short-term and long-term price cycles adjusted for historical volatility, producing a smooth oscillator around a zero line.
Key components include:
- Histogram (KCD): Represents core momentum; zero-line crossings indicate short-term trend changes.
- Dynamic Bands: Volatility-adjusted thresholds signaling overbought or oversold conditions.
- Automated Peak Detection: Identifies momentum extremes signaling potential trend exhaustion.
The KPO provides automated alerts for peak exhaustion and divergence signals, marking bullish and bearish divergences when price and momentum disagree. Trend direction can be confirmed by the histogram’s position relative to zero.
Features include adjustable sensitivity for various asset classes such as Forex, indices, and cryptocurrencies, an integrated alert system (sound, message, visual icons), and modes tailored for scalping or swing trading. The indicator supports analysis based on price bars and outputs reversal and divergence signals to assist in trading decisions.
Profil indikator
Kategori indikator
Momentum
Tipe output
Sinyal
Persyaratan data
Hanya batang
Sinyal yang didukung
Reversal
Divergen

Ulasan pelanggan

5.0
Ulasan: 1
5
100 %
4
0 %
3
0 %
2
0 %
1
0 %
Ulasan pelanggan
May 27, 2026
Reliable tool with a learning curve This indicator takes a little time to get used to, but once you understand how to read the signals properly it delivers solid results. Works best when combined with support and resistance levels and a clear market structure.

Diskusi

Pertanyaan umum

Key Levels
Volume
Produk-produk yang tersedia melalui cTrader Store, termasuk bot trading, indikator, dan plugin, disediakan oleh pengembang pihak ketiga serta hanya ditujukan untuk akses teknis dan informasi. cTrader Store bukan broker dan tidak menyediakan saran investasi, rekomendasi pribadi, atau jaminan apa pun tentang kinerja di masa mendatang.

Produk lain dari penulis ini

Indikator
RSI
Forex
+4
High-probability trading signals in the fast-paced world of forex and CFD trading.
Indikator
Prop
Stocks
+4
High-Performance Renko Chart Indicator with Advanced filtering method - built for Renko and candlestick charts.
Indikator
ATR
MSS
+5
Detects ICT Turtle Soup setups — liquidity sweeps with MSS confirmation, ATR filter & kill zone session filter.
Indikator
EMA
RSI
+2
Advanced TDI indicator with Shark Fin signals, chart arrows, MTF RSI, divergence detection and smart alerts.
Indikator
Fibonacci
Key Levels
DailyTargets: Dynamic ADR-based levels & targets. Includes Buy/Sell zones, previous Hi/Lo, and automated trend alerts.
Indikator
SMC
Prop
+15
Automatic Elliott Wave Detection with Professional Filters
Indikator
Key Levels
Order Block
+3
Marks NY session range, detects wick sweeps beyond box edges.. One signal per day. Overlay, no repainting!
cBot
EMA
SL Manager
+5
Fully automated dual-symbol hedging cBot for cTrader.
20.6%
ROI
8.66
Faktor laba
Indikator
Key Levels
Supertrend
+3
Marks London and New York session opening zones and alerts you instantly on breakouts.
Indikator
MACD
Key Levels
+2
Trend indicator with multi-timeframe filters, generating signals only on fully completed bricks & candles. No Repaint.
Indikator
BOS
Fair Value Gap
+1
ICT Quarterly Theory indicator — color-coded Q1–Q4 session zones with smart entry signals and real-time alerts.
cBot
RSI
Aggressive
automates entries based on the RSX indicator — a smoothed, low-lag variant of the classic RSI.
1.67
Faktor laba

Anda mungkin juga suka

Indikator
Breakout
FlexSR auto‑detects pivot highs/lows to plot dynamic support & resistance lines Features customizable styling and option
Indikator
BOS
MSS
+3
Orderblocks with Multi-Timeframe.
Indikator
Order Block
Fair Value Gap
+2
This indicator contains most of the ICT strategies that you need. You can turn on/off each one to be shown.
Indikator
RSI
Signal
+2
Dynamic circles visualize price's volatility position. Like RSI for market overextension & stretch. Quantify context.
Indikator
Signal
🔹 Trend-Reversal-Indicator for cTrader 🔹 The ultimate Renko chart tool!
Indikator
RSI
MACD
+2
A straightforward yet effective tool signals entry points for both buying and selling. Include 3 Moving Average
Indikator
Signal
Cumulative Volume Delta tracks the net difference in tick volume between buying and selling pressure over time
Indikator
ATR
Prop
+12
🟢 Real swing-based support & resistance with ATR-powered half-bands 🔴
Indikator
SMC
Prop
+12
Multi-TF FVG + Smart Fibonacci
Indikator
Bollinger
Jurik Moving Average (Jurik's Moving Average) triple adaptive filter with unique Jurik smoothing and dynamic factor.
Indikator
Prop
VWAP
+12
FBX VWAP Anchored — Professional VWAP
Indikator
Color-Based Market Pressure & Volatility Visualizer The Kandika Heatmap Indicator
Indikator
SMC
Breakout
+1
Delta Peak Bubbles is a tick‑chart overlay for cTrader that highlights the strongest momentum spikes.
Indikator
Forex
cTrader Auto Support & Resistance detects key levels with Fibonacci analysis and sends real-time trading alerts.
Indikator
Spot Strong Trends Early & Filter Market Noise
Indikator
Drawdown Monitor
Proprietary trading desk risk monitoring dashboard!
Indikator
ATR
The Tenkan-ATR Indicator is a powerful and innovative indicator for Traders. SALE OFF!!!
Indikator
BOS
CHOCH
+1
Maps unmitigated SMC swing points. Draws infinite structure lines until price touches them, labeling BOS & CHoCH breaks.

Harga

Sejak 21/02/2025
466.3M
Volume trading
180.83K
Pip dimenangkan
22
Penjualan
6.87K
Instal gratis