

Descrizione
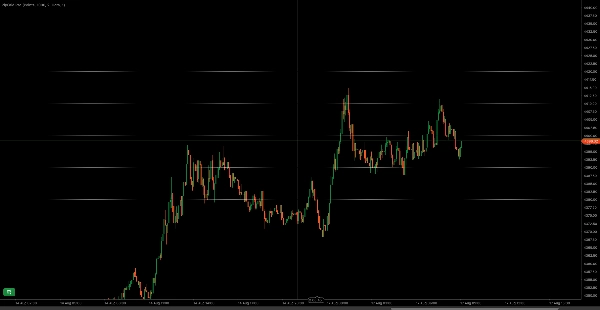
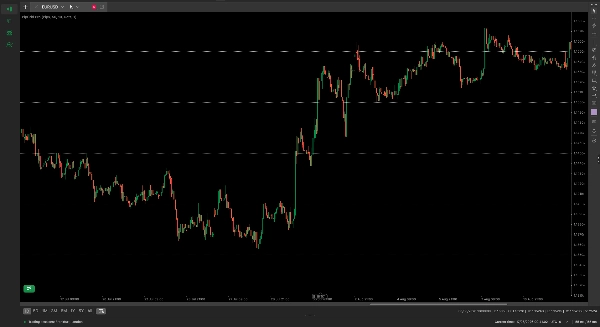
PipGrid Pro traccia automaticamente livelli di prezzo orizzontali puliti e non invasivi calibrati sulla tua esatta strategia di trading senza ingombrare i tuoi grafici.
Il flusso di ordini istituzionali, le posizioni di stop e gli obiettivi di take-profit si raggruppano costantemente intorno a numeri psicologici interi e grandi cifre. Mentre gli script generici si rompono passando da uno strumento all'altro, spesso tracciando linee a migliaia di pips di distanza su Oro o Cripto, PipGrid Pro legge nativamente le specifiche di tick e pip del broker per fornire una spaziatura dei livelli matematicamente accurata su qualsiasi simbolo.
Caratteristiche principali
- Calibrazione universale del simbolo: Passa facilmente tra Pips, Broker Points, e Unità di prezzo per una scala accurata su Forex, Metalli (XAUUSD), Indici e Criptovalute.
- Namespace oggetti sicuro: Disegna esclusivamente sotto l'identificatore isolato RNL_ . Non sovrascriverà, modificherà o eliminerà mai i tuoi disegni manuali sul grafico, i ritracciamenti di Fibonacci o gli indicatori di terze parti.
- Tracciamento dinamico dell'intervallo: Riposiziona automaticamente e aggiorna la finestra della griglia visibile mentre il prezzo di mercato si muove.
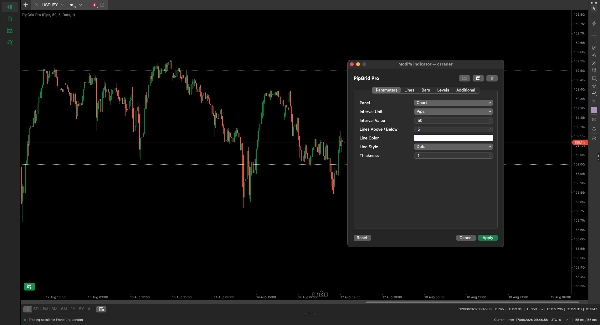
- Personalizzazione visiva completa: Regola colori delle linee, stili (Solido, Punti, Linee, LineePunti) e spessore per adattarti a qualsiasi tema grafico scuro o chiaro.
- Esecuzione leggera: Nessun ritardo nelle prestazioni; i calcoli vengono eseguiti rigorosamente ai confini delle barre live.
Impostazioni dei parametri
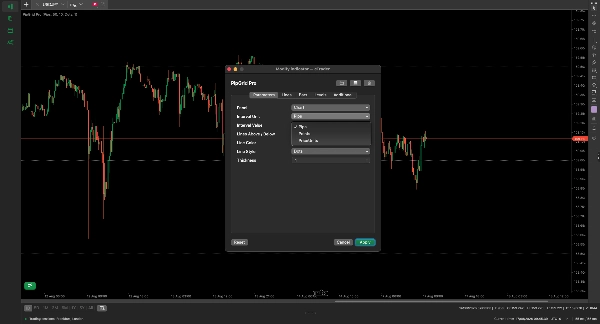
- Unità di intervallo (Predefinito: Pips) — Seleziona la modalità di calcolo tra Pips, Points o Unità di prezzo per una calibrazione esatta dell'asset.
- Valore dell'intervallo (Predefinito: 10.0) — La distanza esatta tra ogni linea orizzontale della griglia.
- Linee sopra / sotto (Predefinito: 20) — Il numero totale di livelli della griglia tracciati sopra e sotto il prezzo di mercato corrente.
- Colore della linea (Predefinito: Grigio) — Colore visivo delle linee della griglia tracciate.
- Stile della linea (Predefinito: Punti) — Motivo visivo per le linee (Solido, Punti, Linee, LineePunti).
- Spessore (Predefinito: 1) — Spessore del tratto delle linee orizzontali (valori da 1 a 5).
Configurazioni consigliate per gli asset
- Forex (EURUSD, GBPUSD): Imposta l'unità su Pips con un intervallo di 50 o 100 per cifre intere istituzionali.
- Oro (XAUUSD): Imposta l'unità su Pips con un intervallo di 10 o 50 per maniglie di prezzo pulite da $1,00 e $5,00.
- Indici (US30, NAS100): Imposta l'unità su Points con un intervallo di 100 o 500 per livelli chiave di traguardi dell'indice.
- Cripto (BTCUSD, ETHUSD): Imposta l'unità su PriceUnits con un intervallo di 1000 o 5000 per barriere psicologiche principali.
Riepilogo
Key functionalities include dynamic range tracking that recenters the grid as price moves, a safe object namespace that prevents interference with manual drawings or other indicators, and full visual customization options for line color, style, and thickness. PipGrid Pro operates efficiently with zero performance lag by executing calculations only on live bar boundaries.
Users can configure parameters such as interval unit and value, number of lines above and below the current price, and visual styles. Recommended settings are provided for different asset classes to highlight institutional order flow clusters and key support/resistance levels. This tool is intended for traders seeking clean, non-intrusive visualization of key price levels that reflect market psychology and institutional activity.

















![Logo di "[Hamster-Coder] Bollinger Bands"](https://cdn.ctrader.com/image/webp/21d8e5d6-fb11-4bac-b9ee-cd05c2b76804_30327)