
Description
CE QUE CELA FAIT
Structural Supertrend répond à une limitation fondamentale du Supertrend classique : il change de direction dès que le prix clôture au-delà de sa bande.
Dans des tendances nettes, cela fonctionne bien. Dans des conditions volatiles ou instables, une seule bougie agressive peut déclencher un retournement — même lorsque la tendance générale reste structurellement intacte. Le résultat est des faux signaux, des sorties prématurées et des ré-entrées à des prix moins favorables.
Cet indicateur est construit autour d'une prémisse différente.
Les changements de direction ne se produisent que lorsque le prix confirme un véritable changement structurel — pas seulement une clôture momentanée au-delà d'un seuil. Le résultat est moins de faux retournements et une meilleure correspondance avec la façon dont les tendances se développent réellement.
Le Supertrend devient structurel. Les signaux deviennent significatifs.
POURQUOI STRUCTURAL SUPERTREND ?
Le Problème
Le Supertrend original considère chaque clôture au-delà de sa bande comme un retournement. C'est intentionnel — cela rend l'indicateur réactif par conception. Mais la réactivité a un coût.
Pendant les phases de consolidation, le prix clôture fréquemment au-delà d'une bande puis inverse immédiatement. Chacun de ces cas génère un signal de retournement, chaque retournement représente une décision de trading potentielle, et chacun représente une sortie d'une position qui n'avait pas besoin d'être clôturée.
Les traders qui ont utilisé Supertrend assez longtemps connaissent bien cette frustration.
La Solution
Structural Supertrend étend le modèle original pour distinguer entre les clôtures dues à la volatilité et les véritables changements directionnels. Il filtre le bruit en exigeant une confirmation structurelle avant de changer la direction de la tendance.
Moins de retournements. Meilleure correspondance avec la tendance. Moins réactif aux bougies individuelles.
Pourquoi garder les deux ?
Le Supertrend original apparaît toujours sur le graphique — mais uniquement là où il diffère de Structural. Ce design est intentionnel.
- Structural suit la direction de la tendance majeure
- Original révèle le comportement impulsif et correctif au sein de cette tendance
Lorsque les deux sont d'accord : forte conviction directionnelle. Lorsqu'ils divergent : le mouvement est probablement correctif, pas un vrai retournement. Cette vue à double couche donne un contexte qu'aucune des deux lignes ne fournit seule.
DÉTECTION DE SWING INTÉGRÉE
Structural Supertrend inclut un cadre complet de détection de swing et de support/résistance — non pas comme une fonctionnalité secondaire, mais comme une extension directe de l'analyse structurelle.
Les swings sont identifiés via un processus de qualification axé sur la structure : chaque candidat est évalué selon le déplacement, la confirmation du volume et la distance relative à l'ATR avant d'être accepté. Cela maintient la carte des swings concentrée sur les points de retournement significatifs plutôt que sur chaque extrême local.
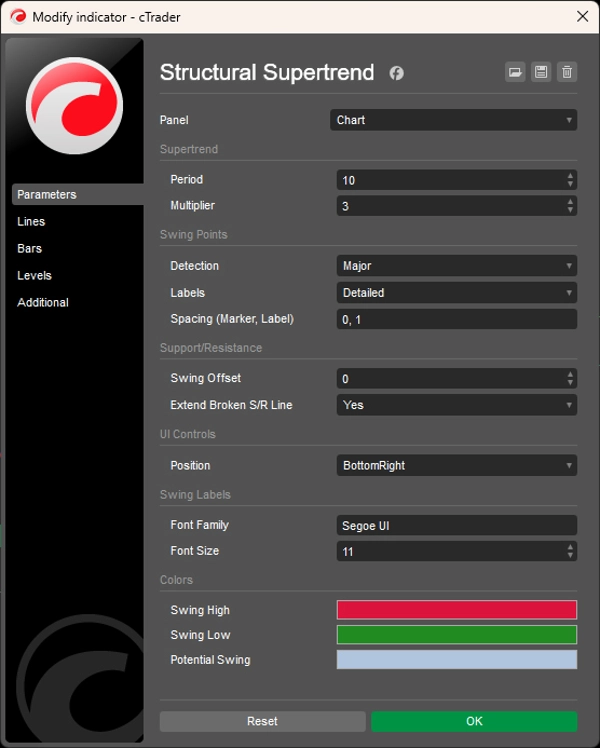
Trois modes de détection
- Mineur — sensibilité accrue, capture les swings internes dans les tendances
- Équilibré — granularité filtrée, meilleur pour la plupart des cas d'utilisation
- Majeur — seuls les pivots structurels les plus forts, confirmés par des critères plus larges
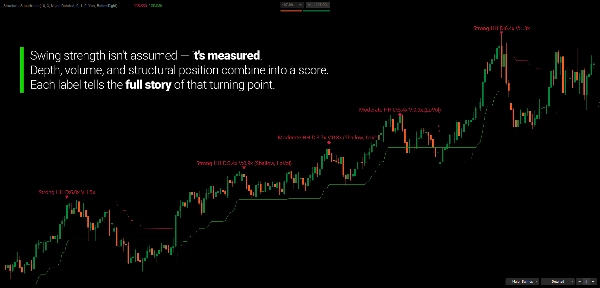
Classification de la force des swings
Chaque swing confirmé est noté selon la profondeur, le volume et la position structurelle par rapport au swing précédent de son type. La force est classifiée dynamiquement en utilisant un classement percentile sur l'historique récent des swings — pas de seuils fixes. Les marqueurs visuels reflètent la classification : triangles pour fort, diamants pour modéré, cercles pour faible.
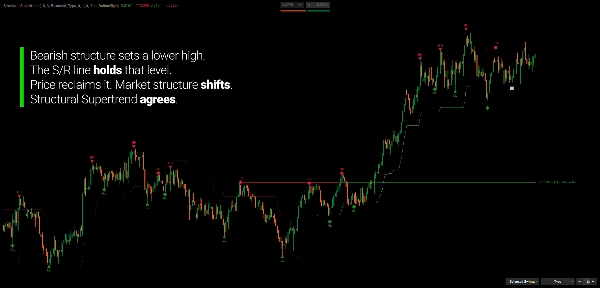
Zones S/R avec suivi de polarité
Les swings confirmés deviennent des niveaux actifs de support/résistance qui suivent leur propre historique d'interaction. Lorsque le prix revisite un niveau, l'indicateur enregistre si le contact était un rejet de mèche ou une cassure de corps. Lorsqu'un niveau est balayé et clôture au-delà, la polarité s'inverse — l'ancienne résistance devient support, et vice versa. Si balayé à nouveau, la zone est invalidée.
Les étiquettes d'âge montrent depuis combien de temps chaque niveau est actif et combien de fois il a été testé.
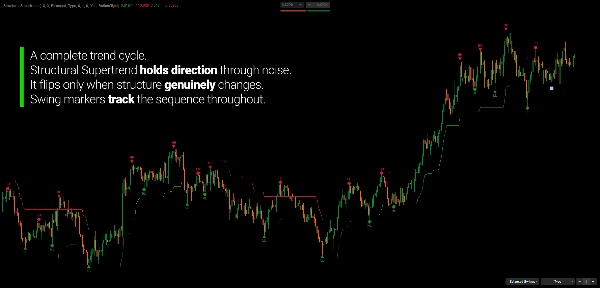
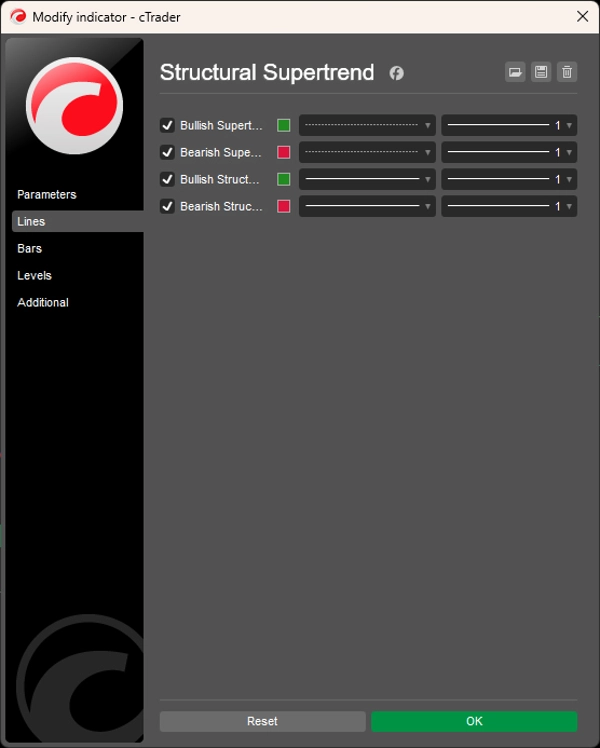
LIRE LE GRAPHIQUE
- Ligne de structure verte : Tendance structurelle haussière (support dynamique)
- Ligne de structure rouge : Tendance structurelle baissière (résistance dynamique)
- Ligne pointillée : Supertrend original — visible uniquement là où il diffère de Structural
- Lignes S/R : Niveaux actifs avec état de polarité et âge
Vérification de l'alignement de la tendance :
- Structure + Original d'accord → Mouvement directionnel à forte conviction
- Structure + Original divergent → Phase probablement corrective ou transitionnelle
POUR QUI C'EST
Cet indicateur est destiné aux traders qui veulent lire la direction de la tendance et la structure du marché à partir d'un cadre unique et cohérent.
Si vous avez utilisé le Supertrend classique et l'avez trouvé trop réactif — changeant fréquemment lors de conditions latérales — Structural Supertrend a été conçu pour répondre précisément à cela.
Il convient bien aux traders de tendance et de swing qui veulent une lecture directionnelle plus claire sans faux retournements constants, aux traders basés sur la structure qui suivent les séquences de swings pour valider la santé de la tendance, et aux traders discrétionnaires qui utilisent les niveaux S/R comme contexte pour les entrées, sorties et gestion de position.
Les contrôles intégrés de l'interface utilisateur le rendent pratique pour une utilisation en temps réel : changez les modes de détection, ajustez les références S/R, et basculez le détail des étiquettes directement sur le graphique — pas besoin d'ouvrir le panneau des paramètres.
Ce n'est pas un générateur de signaux. C'est un cadre d'analyse structurelle pour les traders qui veulent comprendre où se trouve le marché, pas seulement ce qu'il fait en ce moment.
CE QUI LE REND DIFFÉRENT
La plupart des implémentations de Supertrend considèrent chaque clôture au-delà d'une bande comme exploitable. Celle-ci la considère comme un candidat — et exige une preuve structurelle avant de s'engager dans un changement de direction.
La plupart des détecteurs de swings identifient les hauts et bas locaux sans critères d'évaluation. Celui-ci qualifie chaque swing par déplacement, volume et position structurelle — et évalue la force dynamiquement par rapport à l'historique récent des swings.
La plupart des outils S/R tracent une ligne et la laissent. Celui-ci suit l'historique des interactions, signale les changements de polarité, et continue d'évoluer à mesure que le marché revisite chaque niveau.
Le résultat : un outil de tendance et de structure qui reste pertinent plus longtemps, réagit moins au bruit, et construit une image plus riche de la condition du marché au fil du temps.
---
COMPRENDRE L'ANALYSE STRUCTURELLE
La structure du marché ne consiste pas à trouver le "bon" swing ou la "bonne" direction de tendance. Il s'agit de maintenir une image objective de la façon dont les séquences de prix se développent — et si cette séquence reste cohérente ou commence à se dégrader.
Une tendance n'est pas définie par un seul mouvement mais par une série de relations : des plus hauts et plus bas plus élevés dans les tendances haussières, des plus hauts et plus bas plus bas dans les tendances baissières. Chaque nouveau swing confirme ou remet en question la séquence existante. Lorsque la confirmation continue, la structure est intacte. Lorsqu'elle se brise, la structure est en transition.
Ce qui rend l'analyse structurelle utile, ce n'est pas qu'elle prédit où le prix ira, mais qu'elle décrit où le prix se trouve actuellement dans sa propre séquence. Cette distinction est importante. La prédiction nécessite des hypothèses sur l'avenir. L'observation structurelle nécessite seulement une lecture précise de ce qui s'est déjà passé.
Les indicateurs basés sur la logique structurelle sont conçus pour soutenir cette observation — pour rendre la séquence visible et traçable sans introduire d'interprétation subjective. L'objectif est la clarté sur la condition actuelle du marché, pas la certitude sur la direction future des prix.
---
Le trading comporte des risques. Cet indicateur est un outil d'analyse technique — appliquez toujours une gestion appropriée des risques.
Résumé
Avis clients
5 | 67 % | |
4 | 33 % | |
3 | 0 % | |
2 | 0 % | |
1 | 0 % |


![Logo de "[Stellar Strategies] MARSI Signal Plotter"](https://cdn.ctrader.com/image/webp/7b2b8da6-8f8e-4646-8d4a-4710c516c01e_25567)


