الوصف
توقع السعر الديناميكي 📈🔮
https://chartshots.spotware.com/c/69d5304ea1cc1
ما هو؟
https://chartshots.spotware.com/c/69d52fb4b01cd
توقع السعر الديناميكي هو مؤشر تراكبي يتوقع مسارات الأسعار المستقبلية المحتملة إحصائياً باستخدام محاكاة مونتي كارلو ويقيّم التحيز الاتجاهي من خلال مصنف احتمالية بايزي. يجيب على سؤال واحد: بالنظر إلى كيفية تحرك هذا الأصل، أين من المحتمل إحصائياً أن يتجه بعد ذلك؟ 📊
https://chartshots.spotware.com/c/69d53010d38ce
كيف يعمل ⚙️
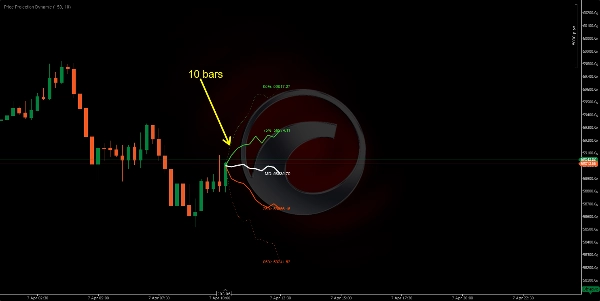
المحرك 1 — توقع مونتي كارلو 🎲
يقوم المؤشر بتحليل تاريخ السعر الأخير واستخراج العوائد اللوغاريتمية. يحسب متوسط العائد وانحرافه المعياري — مما يلتقط كل من الانجراف (الاتجاه) و التقلب (الحركة العشوائية) 🌪️.
يقوم بتشغيل 200 مسار سعر محاكاة (حتى 500) في المستقبل. كل محاكاة هي "مسيرة عشوائية" بناءً على الحركة الأخيرة الحقيقية. من هذه، يستخرج المؤشر 5 نطاقات مئوية:
النطاق
المعنى
95%
الحد الأقصى المتفائل — فقط 5% من المحاكاة تجاوزت هذا المستوى 🚀
75%
النطاق المحتمل الأعلى — انتهى السعر فوق هذا في 25% من المحاكاة 📈
50% (MD)
التوقع الوسيط — المركز الإحصائي لجميع النتائج 🎯
25%
النطاق المحتمل الأدنى — انتهى السعر أدناه في 25% من المحاكاة 📉
05%
الحد الأقصى المتشائم — فقط 5% من المحاكاة كانت أقل من هذا المستوى 📉🛑
نصيحة محترف: كلما اتسع المروحة، زاد التقلب الحالي 📢. المروحة الضيقة تعني أن الأصل يتحرك بشكل متوقع 🧵.
المحرك 2 — المصنف البايزي 🧠
مستقل عن التوقع، يصنف هذا المحرك السوق على أنه صاعد أو هابط من خلال:
- النظر إلى الوراء عبر نافذة (الافتراضي 500 شريط) 🔍.
- قياس الحجم النسبي و الزخم للأشرطة الصاعدة مقابل الهابطة.
- حساب أي ملف تعريف يناسب الشريط الحالي بشكل أفضل باستخدام احتمالية Gaussian ⚖️.
النتيجة هي نسبة احتمال الفوز:
الاحتمالية
التفسير
> 70%
ثقة صعودية عالية ✅🟢
50–70%
متوسطة / غير واضحة ⚖️🟡
< 30%
ثقة هبوطية عالية ✅🔴
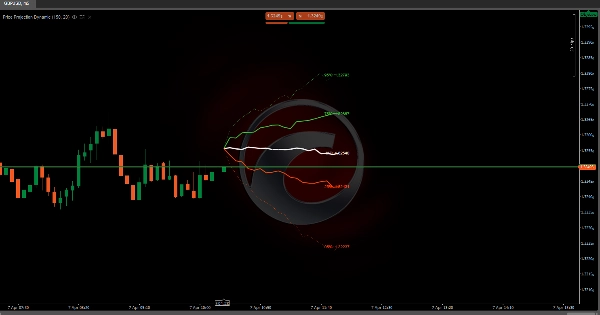
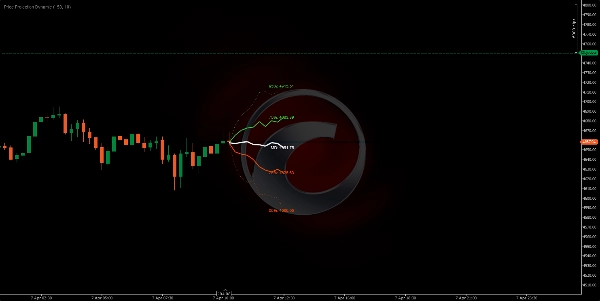
العناصر المرئية 🎨
- الخطوط الخضراء (75%, 95%): نطاقات التوقع العليا — نطاق صاعد 🍏
- الخط الأبيض (MD): السعر المتوقع الوسيط — المسار الأكثر احتمالاً 🏁
- الخطوط البرتقالية (25%, 05%): نطاقات التوقع السفلى — نطاق هابط 🍊
- الخطوط الخارجية المنقطة: حدود 95% و 05% القصوى (حدود احتمالية منخفضة) ⚠️
- الخطوط الداخلية الصلبة: 75%, 50%, 25% (منطقة احتمالية عالية) ✅
- تسميات السعر: السعر المتوقع الدقيق لكل مئوية 🏷️
- لوحة المعلومات (أعلى اليمين): احتمالية الفوز البايزية، الهدف الوسيط، الحجم النسبي، اتجاه الإشارة 🖥️
كيفية الاستخدام 📖
- اقرأ شكل المروحة 📢 — إذا توسعت بسرعة، يكون التقلب عالياً والتوقعات أقل يقيناً.
- استخدم خط الوسيط (MD) 🎯 كهدف سعر مستقبلي محتمل إحصائياً.
- استخدم نطاقات 75%/25% 📏 كأهداف عليا/سفلى واقعية للصفقات.
- استخدم نطاقات 95%/05% 🛑 كحدود قصوى — مفيدة لوضع وقف الخسارة.
- تحقق من لوحة بايزي 🧠 — احتمال فوق 70% أو تحت 30% يضيف قناعة اتجاهية.
- اجمع بين المحركين 🤝 — إذا كان خط الوسيط يميل صعوداً و احتمالية بايزي > 70%، فإن الإعداد قوي إحصائياً.
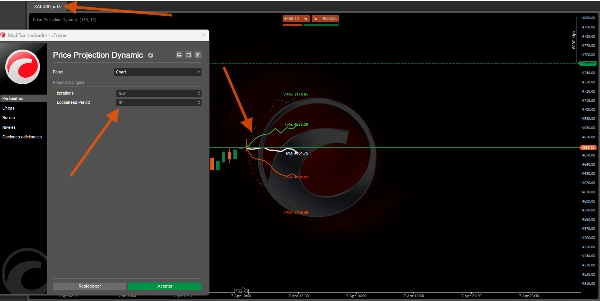
المعلمات الرئيسية ⚙️
المعلمة
ما تتحكم به
القيمة الأعلى
القيمة الأدنى
التكرارات
عدد المسارات المحاكاة
نطاقات أكثر سلاسة 🌊
حساب أسرع ⚡
النظرة المستقبلية
مسافة التوقع المستقبلية
أفق أطول 🔭
أقصر وأكثر موثوقية 🔍
عمق العينة
الأشرطة الأخيرة للتحليل
السلوك طويل الأمد 🐢
السلوك الأخير فقط 🐇
نافذة المصنف
تاريخ بايزي
احتمالية أكثر استقراراً ⚖️
أكثر تفاعلية ⚡
ملف تعريف المؤشر 📋
- فئة المؤشر: إحصائيات 📊
- نوع الإخراج: تصور وإشارات 🖼️
- متطلبات البيانات: أشرطة فقط 📶
إخلاء المسؤولية ⚠️
هذا المؤشر يتوقع احتمالات إحصائية، وليس تنبؤات 🔮. تفترض محاكاة مونتي كارلو أن المستقبل سيشبه الماضي القريب — وهذا ينكسر خلال أحداث البجعة السوداء 🦢 أو الفجوات الناتجة عن الأخبار. استخدمها كإطار احتمالي إلى جانب إدارة المخاطر الخاصة بك 🛡️.
الملخص
Separately, the Bayesian classifier evaluates market sentiment by analyzing relative volume and momentum over a configurable window, providing a win probability percentage that indicates bullish or bearish confidence. Visual elements include color-coded projection bands (green for bullish, orange for bearish), a median price line, price labels for each percentile, and an info panel displaying Bayesian probability and other metrics.
Key adjustable parameters include the number of simulation iterations, projection horizon, sample depth of historical bars, and classifier window size. The indicator requires bar data with volume and outputs visual projections and directional signals. It is designed to offer a probabilistic framework for anticipating price movement based on recent market behavior, suitable for various symbols including BTCUSD, EURUSD, GBPUSD, XAUUSD, NAS100, and others.
تقييمات العملاء
5 | 0 % | |
4 | 100 % | |
3 | 0 % | |
2 | 0 % | |
1 | 0 % |


![شعار "[Hamster-Coder] Bollinger Bands"](https://cdn.ctrader.com/image/webp/21d8e5d6-fb11-4bac-b9ee-cd05c2b76804_30327)