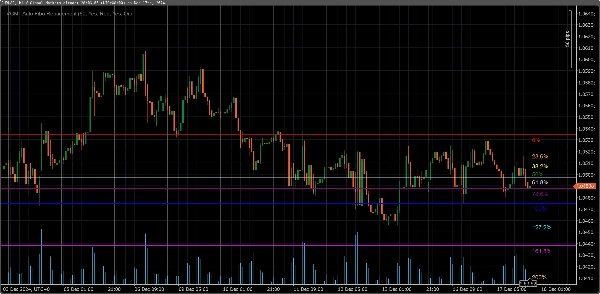
Brokerzy i firmy proptradingowe
Dla firm
00
Days
:
00
Hours
:
00
Minutes
:
00
Seconds
VGM - Auto Fibo Retracement
3.3
03/09/2025
975
Desktop
Od 17/12/2024
Bezpłatne instalacje
975
Przesłany obraz „VGM - Auto Fibo Retracement”

This Auto Fibonacci Retracement Indicator automatically calculates and draws Fibonacci retracement levels on the chart based on the highest high and lowest low within a customizable lookback period. Users can configure colors and enable/disable specific Fibonacci levels, including popular extensions above 100% such as 127.2%, 161.8%, 200%, and 261.8%.

Key Features:
1. **Automatic Swing Detection**: Detects swing highs and lows dynamically within the chosen lookback period.
2. **Customizable Levels**: Enable/disable specific Fibonacci levels as per preference.
3. **Color Settings**: Choose individual colors for each level for better visual distinction.
4. **Extended Levels**: Includes commonly used extensions (127.2%, 161.8%, 200%, and 261.8%) for trend continuation analysis.
5. **Real-Time Updates**: Levels automatically adjust to changes in market conditions.

Ideal For:
- Traders using Fibonacci retracement and extensions for entry/exit levels.
- Users who need a clean, flexible, and automated Fibonacci tool.


Build by VantoFX. https://vantofx.com Free for all.

3.3
Opinie: 3
5
33 %
4
33 %
3
0 %
2
0 %
1
33 %
Opinie klientów
January 21, 2026
Sadly this iindicator makes drawings like trend lines, horizobtal lines, Fibonacci etc disappear within a second of traying to draw them. Obviously a problem with the coding so fix it and it would be worth a 5*
August 10, 2025
This is helpful my friend, thanks for the upload :)
July 9, 2025
Pros: Automatically detects swing points and plots Fibonacci retracement levels. Easy to use, customizable, works across timeframes. Cons: No tooltips or alerts. Lacks template saving and historical swing tracking. Requires additional confirmation tools for reliable trading.
Możesz także polubić
Wskaźnik
Indices
Prop
Stocks
+3
Equity and Balance
Displays real-time balance, equity, P&L, margin metrics directly on your charts.
Najwyżej oceniane
Za darmo
Wskaźnik
RSI
Breakout
Supertrend
Swing Levels
🔍 Automatically detect support and resistance levels based on "swings" or pivots
Najwyżej oceniane
Za darmo
Wskaźnik
NAS100
XAUUSD
Commodities
+3
Volume Squeeze Time
Volume Squeeze, real-time buying and selling.
Donchian Flux Cloud
Trend-coloring Donchian cloud that highlights volatility squeezes and breakouts.
Wskaźnik
NAS100
Indices
XAUUSD
+6
OR Session Zones
A high‑precision Opening Range indicator that detects session opens (NY, London, EU, Tokyo, Shanghai)
Wskaźnik
Breakout
Waddah Attar Explosion
Combines MACD momentum with Bollinger Bands volatility to identify explosive price breakout moments.
Wskaźnik
Indices
Prop
Stocks
+3
Smooth Heiken Ashi
The Smooth Heiken Ashi indicator is a refined charting tool designed to filter out market noise and highlight true price
Drawing Utility
A rectangular box with 5 adjustable Fibonacci level or even custom ones.
Clarosti
Clarosti a chave para decisões inteligentes no mercado
Wskaźnik
NAS100
NZDUSD
XAUUSD
+10
Elliott Wave2 with Markov 5-State Confidence
Elliott Wave 2 indicator with Markov probability analysis and a confidence score to assess Wave 3 continuation quality.
Wskaźnik
Grid
NAS100
NZDUSD
+18
SmartFractalZigZagPlus
Smart fractals + auto Fibonacci + dynamic S/R zones with HTF confluence & Bull/Bear bias panel. Institutional-grade.
Wskaźnik
Grid
Indices
Breakout
+9
crossover 1
Crossover Buy and Sell Alerts and signals