
DynamicVolumeSupplyDemand
مؤشر
1.29K التنزيلات
الإصدار 1.0، Apr 2025
Windows, Mac
4.2
التقييمات: 5
الوصف
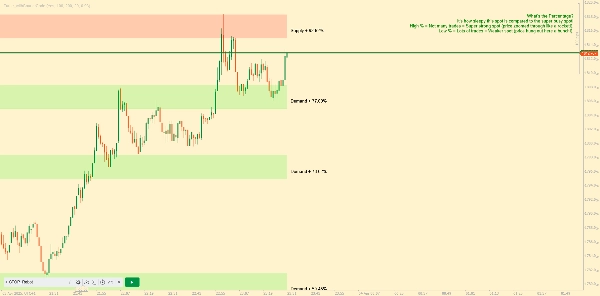
تقديم مناطق العرض والطلب الديناميكية بواسطة AlgoAlpha التي أعيد إنشاؤها بواسطتي لمنصة Ctrader. تم تصميم هذا المؤشر لتحديد وتصور مناطق العرض والطلب الديناميكية تلقائيًا على الرسم البياني الخاص بك، مما يساعد المتداولين على تحديد مناطق الانعكاس المحتملة وتقييم معنويات السوق بوضوح معزز. يتكيف مع ظروف السوق باستخدام آلية نظر ديناميكية، مما يجعله أكثر استجابة لتحركات الأسعار الأخيرة. 📈💡
الميزات الرئيسية
- 📊 النظر الديناميكي للخلف: يقوم بضبط فترة النظر للخلف تلقائيًا بناءً على نقطة المحور الأخيرة، مما يضمن تحليل البيانات الأكثر صلة.
- 🎯 كشف نقطة المحور: يستخدم فترة محددة من قبل المستخدم لاكتشاف قمم وقيعان المحور المهمة، مع تحديد نقاط الانعكاس المحتملة بدقة.
- 🛠 معلمات قابلة للتخصيص: يقدم خيارات تخصيص واسعة تشمل فترة النظر للخلف، حساسية كشف المحور، الدقة، وتحمل المنطقة.
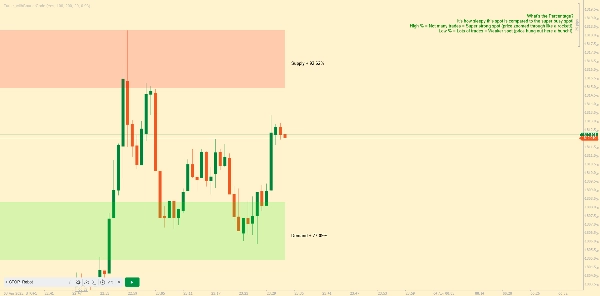
- 🗺 العرض المرئي: يعرض مناطق العرض والطلب كصناديق على الرسم البياني، مع تمييز الخلفية لتمييز المناطق الصاعدة والهابطة.
- 🖍 مناطق ملونة: يتم ترميز المناطق بالألوان لتسهيل التعرف عليها: الأخضر للصعود، الأحمر للهبوط، والرمادي للمستويات المحايدة.
الملخص
ملخص الذكاء الاصطناعي
DynamicVolumeSupplyDemand is an indicator for the cTrader platform that automatically identifies and visualizes dynamic supply and demand zones on trading charts. It helps traders locate potential reversal areas and evaluate market sentiment by adapting to recent price movements through a dynamic look-back mechanism. Key features include:
- Dynamic Look-Back: Automatically adjusts the look-back period based on the latest pivot points to analyze the most relevant data.
- Pivot Point Detection: Uses a user-defined period to detect significant pivot highs and lows, marking potential reversal points.
- Customizable Parameters: Allows adjustment of look-back period, pivot detection sensitivity, resolution, and zone tolerance.
- Visual Display: Presents supply and demand zones as boxes on the chart with background highlighting to distinguish bullish and bearish zones.
- Color-Coded Zones: Zones are color-coded for clarity—green for bullish, red for bearish, and gray for neutral levels.
This indicator supports enhanced clarity in market analysis by dynamically adapting to changing market conditions and providing clear visual cues for supply and demand levels.
ملف تعريف المؤشر
تقييمات العملاء
4.2
التقييمات: 5
5 | 40 % | |
4 | 40 % | |
3 | 20 % | |
2 | 0 % | |
1 | 0 % |
تقييمات العملاء
October 12, 2025
Could you please make a new indicator so too remove the explanation and how the indicator works written on the chart? Very nice indicator otherwise!
August 12, 2025
Pros: Identifies dynamic supply and demand zones based on volume. Flexible settings, strong visual clarity. Cons: No alerts or tooltips. Lacks history of previous zones and user template saving.
May 15, 2025
This indicator finds the supply and demand areas very well but it has a problem. But the explanation and how the indicator works written on the chart is very annoying. I hope the designer of this software will solve this problem. Thank you
مناقشة
الأسئلة الشائعة
يتم توفير المنتجات المتاحة من خلال cTrader Store، بما في ذلك روبوتات التداول والمؤشرات والإضافات، من قبل مطوري الطرف الثالث وإتاحتها لأغراض الوصول المعلوماتي والفني فقط. cTrader Store ليس وسيطًا ولا يقدم نصائح استثمارية أو توصيات شخصية أو أي ضمان للأداء المستقبلي.
قد يعجبك أيضًا
![شعار "[Hamster-Coder] Bollinger Bands"](https://cdn.ctrader.com/image/webp/21d8e5d6-fb11-4bac-b9ee-cd05c2b76804_30327)


![شعار "[Stellar Strategies] Wave Trend Pro"](https://cdn.ctrader.com/image/webp/5f226fbb-245a-41cd-9cdd-b018257d5e6d_28617)


السعر
منذ 09/01/2025
11.78K
التثبيتات المجانية