
E7 Indicators Free Overlays
Indicatore
375 download
Versione 1.0, Feb 2025
Windows, Mac
5.0
Recensioni: 2
Descrizione
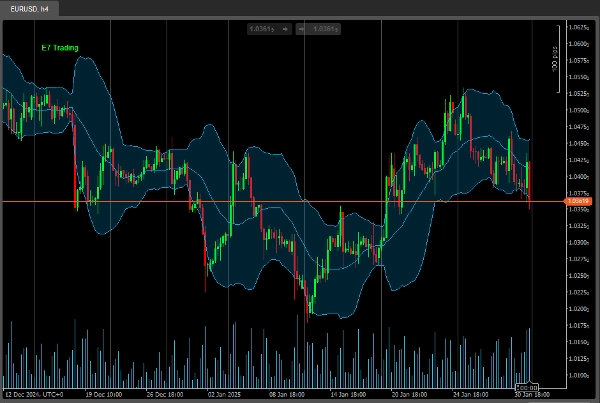
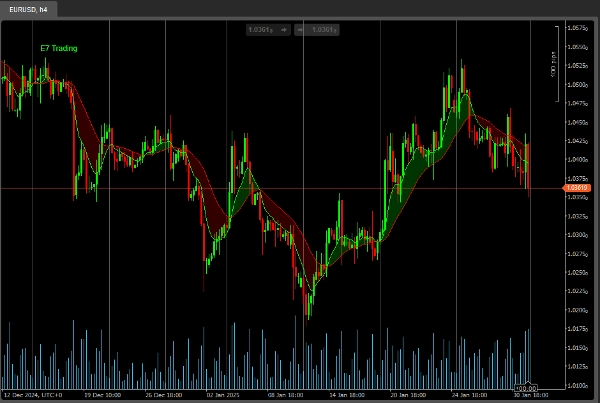
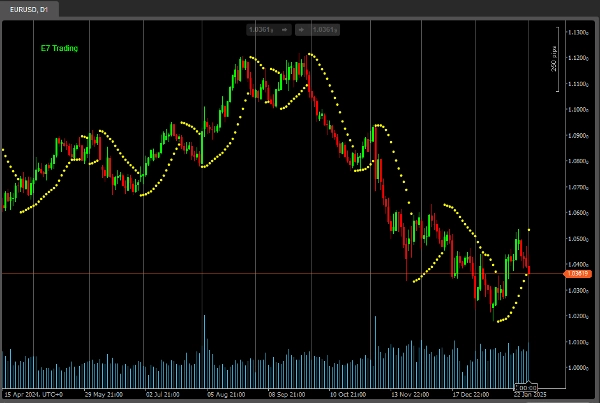
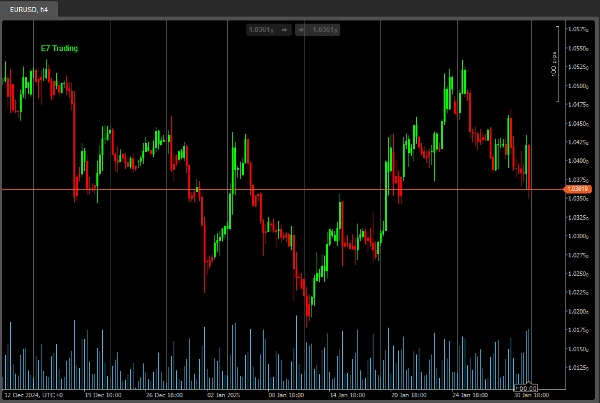
Gli indicatori sovrapposti gratuiti E7 includono solo i seguenti
- Nuvola Bollinger Band
- Heiken Ashi
- Seguace del Trend
- Parabolic SAR.
Buona caccia!
Riepilogo
Riepilogo AI
E7 Indicators Free Overlays is a collection of four technical overlay indicators designed for trading chart analysis. It includes the Bollinger Band Cloud, which visualizes volatility and potential price ranges; Heiken Ashi, a candlestick variant that smooths price action to identify trends; Trend Follower, an indicator aimed at highlighting prevailing market directions; and Parabolic SAR, which signals potential trend reversals and helps set trailing stop levels. These overlays are applied directly on price charts to assist traders in identifying market trends, volatility, and entry or exit points. The product supports multiple chart types and is suitable for various trading instruments where these indicators are applicable.
Profilo indicatore
Recensioni dei clienti
5.0
Recensioni: 2
5 | 100 % | |
4 | 0 % | |
3 | 0 % | |
2 | 0 % | |
1 | 0 % |
Recensioni dei clienti
December 21, 2025
August 18, 2025
Combines multiple tools in one, customizable, versatile. Cons: Can overload chart, slight lag with all features enabled.
Discussioni
Domande frequenti
Bollinger
I prodotti disponibili tramite cTrader Store, inclusi bot di trading, indicatori e plugin, sono forniti da sviluppatori terzi e resi disponibili esclusivamente a scopo informativo e di accesso tecnico. cTrader Store non è un broker e non fornisce consulenze in materia di investimento, raccomandazioni individualizzate o garanzie di risultati futuri.
Altro da questo autore


![Logo di "[Hamster-Coder] Pivot Points MTF"](https://cdn.ctrader.com/image/webp/4c143e5a-309c-40e3-a578-f04d1e133ffa_31159)


Prezzo
Da 18/12/2024
2
Vendite
4.24K
Installazioni gratuite