
E7 Indicators Free Studies
Indikator
188 downloads
Version 1.0, Feb 2025
Windows, Mac
Beschreibung
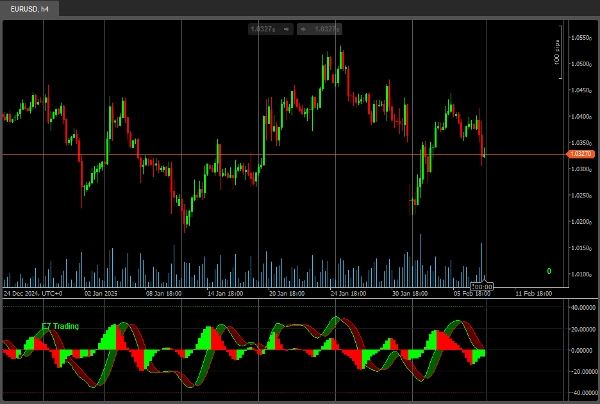
Die E7 Free Studies Indikatoren umfassen nur die folgenden
- ADXR
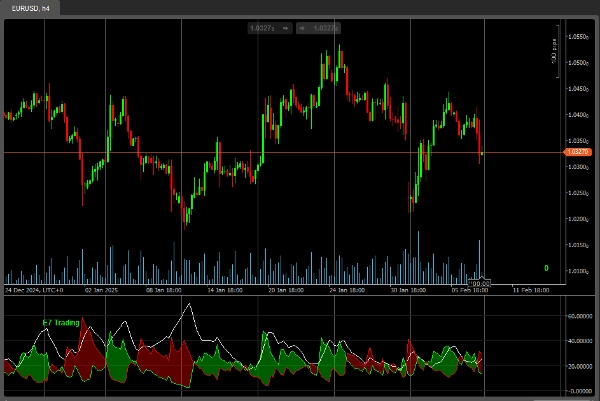
- AEOscillator
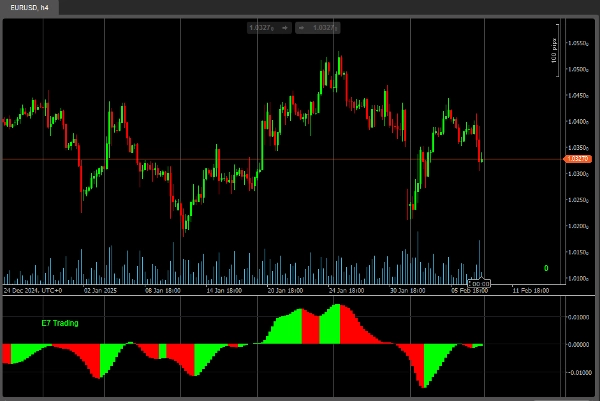
- Bollinger Band Volatilität
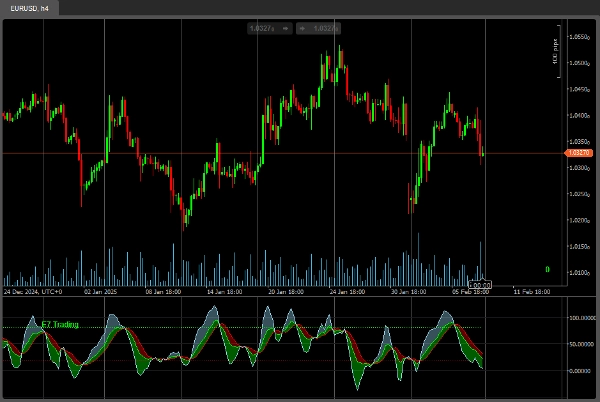
- KDJ
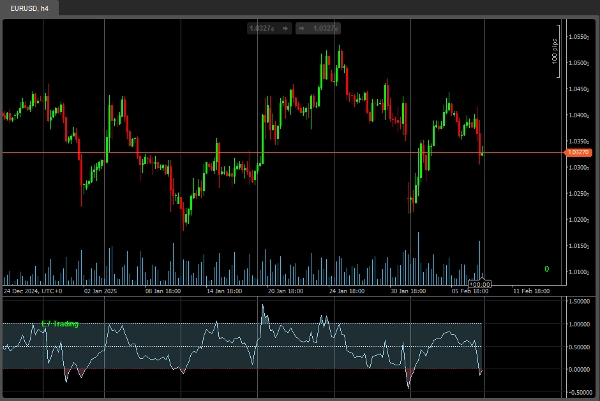
- Sinuswelle
Viel Erfolg bei der Suche!
Zusammenfassung
KI-Zusammenfassung
E7 Indicators Free Studies is a collection of technical analysis indicators designed for use in trading platforms. It includes five specific studies: ADXR, AEOscillator, Bollinger Band Volatility, KDJ, and Sine Wave. These indicators provide various methods to analyze market trends, momentum, volatility, and cyclical price movements. The product supports application across different markets where these indicators are relevant. Each indicator offers distinct analytical insights, such as trend strength (ADXR), oscillator-based momentum (AEOscillator), volatility measurement (Bollinger Band Volatility), stochastic momentum (KDJ), and cyclical wave patterns (Sine Wave). This set is intended to assist traders in technical analysis by providing multiple complementary tools within a single package.
Indikatorprofil
Kundenbewertungen
0.0
Bewertungen: 0
Kundenbewertungen
Bisher gibt es keine Bewertungen für dieses Produkt. Haben Sie es schon ausprobiert? Dann können Sie die erste Person sein, die andere darüber informiert!
Diskussion
Häufig gestellte Fragen (FAQ)
Bollinger
Über den cTrader Store verfügbare Produkte, einschließlich Handelsbots, Indikatoren und Plugins, werden von externen Entwicklern bereitgestellt und nur zu Informations- und technischen Zugriffszwecken verfügbar gemacht. cTrader Store ist kein Broker und erbringt keine Anlageberatung, persönlichen Empfehlungen oder eine Garantie für zukünftige Performance.
Mehr von diesem Autor


![„Smart Money Concepts (SMC) [Iridio Capital]“-Logo](https://cdn.ctrader.com/image/webp/28b69fd1-ef54-4bed-9487-07e78e883be4_40934)


Preis
Seit 18/12/2024
2
Verkäufe
4.24K
Kostenlose Installationen