Descrizione
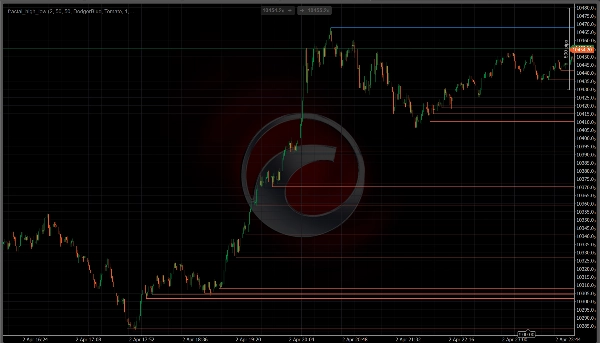
Se fai trading con l'azione del prezzo, sai già che i livelli più
importanti in qualsiasi grafico sono i massimi e minimi frattali —
i punti di oscillazione dove il prezzo è stato respinto, invertito o ha rotto
la struttura. Frac High Low Lines trova questi punti per te
e li disegna automaticamente, così puoi concentrarti interamente su
leggere il prezzo piuttosto che gestire i disegni.
──────────────────────────────────────────────────────────
COME FUNZIONA
──────────────────────────────────────────────────────────
L'indicatore utilizza la logica classica del frattale di Williams per confermare
i punti pivot. Un massimo frattale è valido solo quando il suo massimo è
strettamente maggiore delle barre circostanti su entrambi i lati. Un
minimo frattale è valido solo quando il suo minimo è strettamente inferiore.
Una volta confermato, viene tracciata una linea orizzontale da quel pivot
e prolungata in avanti — fornendoti un chiaro riferimento visivo
per ogni livello strutturale significativo sul grafico.
Nessun ridisegno. I frattali sono confermati solo dopo che un numero sufficiente di barre
si sono chiuse su entrambi i lati, quindi i livelli non appaiono né
scompaiono mentre il prezzo si muove.
──────────────────────────────────────────────────────────
CARATTERISTICHE PRINCIPALI
──────────────────────────────────────────────────────────
• Rilevamento automatico dei frattali — scansiona tutte le barre al caricamento, poi
si aggiorna in tempo reale man mano che si formano nuove barre
• Periodo frattale configurabile — usa il periodo 2 per ogni
oscillazione minore, oppure aumentalo per isolare solo i massimi
e minimi strutturali maggiori
• Controllo massimo linee — limita in modo indipendente quante
linee di resistenza e supporto vengono mostrate contemporaneamente, mantenendo il tuo
grafico pulito e focalizzato sulla struttura recente
• Rimozione livelli rotti — rimuove automaticamente una linea
opzionalmente quando il prezzo la attraversa in chiusura, così rimangono visibili solo i livelli intatti
• Controllo visivo completo — imposta colore, spessore e stile
della linea (Solido, Tratteggiato, Puntinato) in modo indipendente per massimi e
minimi
• Leggero — ogni linea viene disegnata una sola volta e mai ridisegnata,
quindi le prestazioni rimangono fluide anche su grafici M1 o M5
──────────────────────────────────────────────────────────
A CHI È RIVOLTO
──────────────────────────────────────────────────────────
Creato specificamente per i trader di price action che usano i massimi
e minimi di swing per identificare la struttura, pianificare le entrate di trading,
impostare stop loss e individuare potenziali zone di inversione o breakout.
Funziona su qualsiasi simbolo e qualsiasi timeframe in cTrader.
──────────────────────────────────────────────────────────
GRATIS — SENZA VINCOLI
──────────────────────────────────────────────────────────
Frac High Low Lines è completamente gratuito. Installalo, aggiungilo
al tuo grafico e fai trading con livelli di struttura più chiari fin dalla
tua primissima sessione.
==========================================================
Riepilogo
The indicator updates in real time as new bars form and scans all bars on load. It offers configurable fractal periods to capture minor or major swings, controls to limit the number of displayed lines for clarity, and an option to automatically remove lines when price closes through them. Users can customize line color, thickness, and style independently for highs and lows. The indicator is lightweight, drawing each line once to maintain smooth performance even on low timeframes like M1 or M5.
fractal_high_low works on any symbol and timeframe within the cTrader platform and supports markets including Forex, stocks, commodities, indices, and cryptocurrencies. It aids traders in identifying market structure, planning entries, setting stops, and spotting reversal or breakout zones.


