
E7 Volume Profile
Indicatore
1.15K download
Versione 1.0, Feb 2025
Windows, Mac
4.6
Recensioni: 3
Descrizione
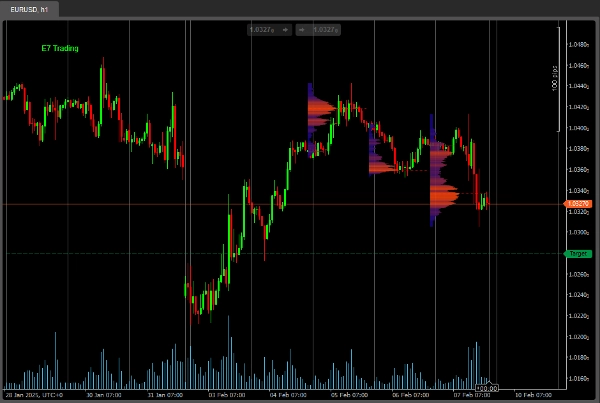
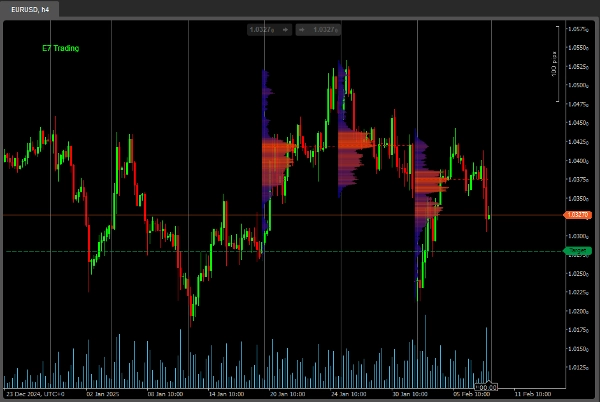
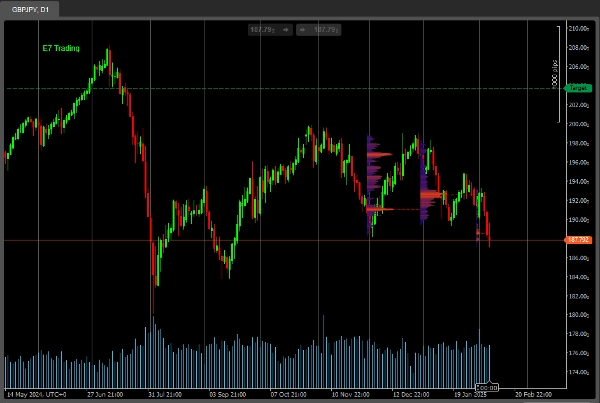
Questo è un semplice indicatore Volume Profile, personalizzato per un aspetto e una sensazione più moderni.
Questa versione base è limitata a soli 3 'Periodi di Riferimento'.
La versione completa arriverà presto, resta sintonizzato.
Buona caccia!
Riepilogo
Riepilogo AI
E7 Volume Profile is a volume profile indicator designed with a modern visual style. It provides traders with volume distribution information over price levels, helping to identify key support and resistance areas. This basic version supports analysis over three distinct lookback periods, allowing users to observe volume patterns within limited historical ranges. The indicator is suitable for use on various timeframes, as illustrated by examples on 1-hour, 4-hour, and daily charts. A full version with expanded features is planned for future release.
Profilo indicatore
Recensioni dei clienti
4.6
Recensioni: 3
5 | 67 % | |
4 | 33 % | |
3 | 0 % | |
2 | 0 % | |
1 | 0 % |
Recensioni dei clienti
July 14, 2025
Pros: Clearly visualizes volume distribution with POC, VAH, VAL zones. Customizable and stable across timeframes. Cons: No tooltips or alerts. Lacks template saving and dynamic profile history. Requires confirmation tools for trading signals.
Discussioni
Domande frequenti
I prodotti disponibili tramite cTrader Store, inclusi bot di trading, indicatori e plugin, sono forniti da sviluppatori terzi e resi disponibili esclusivamente a scopo informativo e di accesso tecnico. cTrader Store non è un broker e non fornisce consulenze in materia di investimento, raccomandazioni individualizzate o garanzie di risultati futuri.
Altro da questo autore


Prezzo
Da 18/12/2024
2
Vendite
4.25K
Installazioni gratuite