
Описание
EMAScalpHistogram: Визуализация импульса для управления сделками
Что такое EMAScalpHistogram?
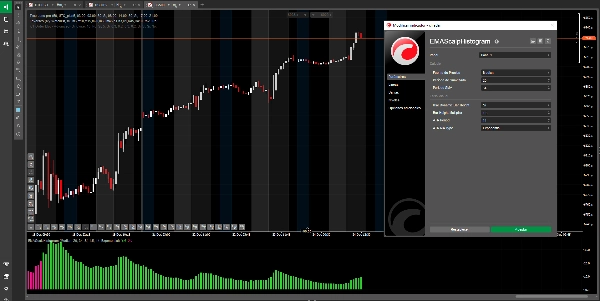
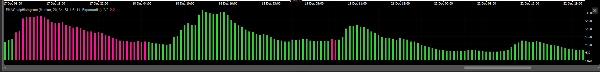
EMAScalpHistogram — это продвинутый инструмент технического анализа, который преобразует сложность рыночного импульса в интуитивно понятный и визуально привлекательный гистограммный график. Его дизайн позволяет определить силу и направление тренда с первого взгляда.
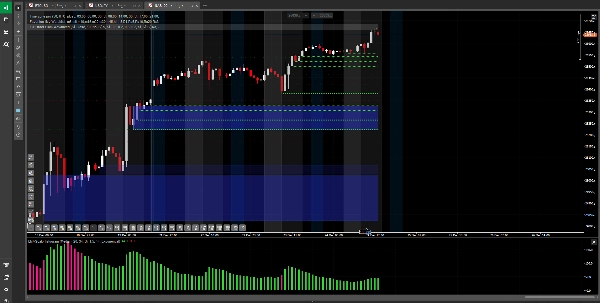
- Зелёные бары (бычьи): указывают на сильный покупательский импульс, что говорит о контроле рынка со стороны покупателей.
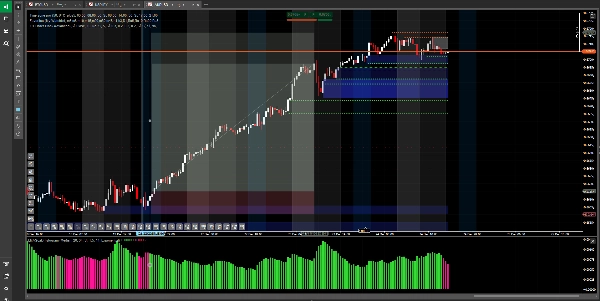
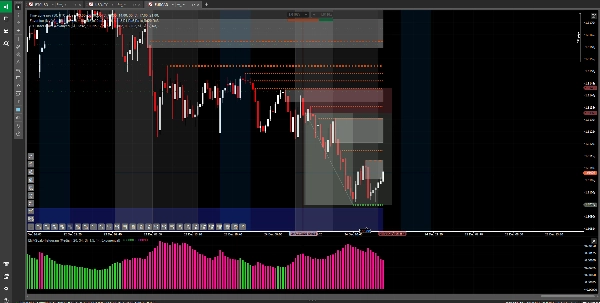
- Розовые бары (медвежьи): указывают на сильный продавецкий импульс, что говорит о доминировании продавцов в ценовом движении.
- Динамическая высота: высота баров не фиксирована; она адаптируется к волатильности рынка. Более высокие бары сигнализируют о движениях с большей силой и уверенностью, в то время как более низкие бары указывают на паузу или ослабление тренда.
Основное применение и рекомендуемая стратегия
EMAScalpHistogram — это элитный инструмент управления сделками, предназначенный для трейдеров, стремящихся максимизировать прибыль, удерживая позиции с большей уверенностью. Его главная ценность заключается в помощи сохранить и увеличить вашу прибыль, когда вы уже находитесь в сделке.
- Подтверждение тренда: его самая мощная функция — подтверждать силу уже выявленного тренда. Если вы находитесь в длинной позиции и гистограмма постоянно показывает зелёные бары, это визуальное подтверждение того, что покупательский импульс сохраняется.
- Управление сделками (удержание и увеличение прибыли):
-
- Для удержания позиций: это его самое ценное применение. Используйте его, чтобы решать, когда с уверенностью удерживать позицию. Если гистограмма продолжает показывать бары в вашу пользу, это даёт дисциплину не закрывать прибыльную сделку преждевременно из-за незначительных колебаний рынка.
- Для увеличения прибыли: помогая удерживать позицию на протяжении всей фазы сильного импульса, он позволяет захватывать более крупные движения и увеличивать потенциал прибыли.
- Сигнал ослабления импульса: изменение цвета гистограммы (с зелёного на розовый или наоборот) является одним из первых сигналов, что импульс иссякает, что может означать, что пора зафиксировать прибыль или скорректировать стратегию выхода.
Чего следует избегать
Не является сигналом для входа: критически важно, что EMAScalpHistogram не предназначен для использования в качестве самостоятельного сигнала для открытия новых сделок. Как индикатор, подтверждающий силу уже начавшегося движения, его использование для входа может привести к запоздалым сделкам с высоким риском и ограниченным потенциалом прибыли.
Предупреждение о рисках и отказ от ответственности
Использование этого индикатора осуществляется на ваш собственный риск и ответственность. Торговля финансовыми инструментами связана с высоким уровнем риска и может не подходить всем инвесторам. Этот инструмент не является инвестиционной рекомендацией или финансовым советом. Прошлые результаты не гарантируют будущих. Настоятельно рекомендуется тестировать любую стратегию на демо-счёте перед риском реального капитала.
Сводка
Отзывы покупателей
5 | 67 % | |
4 | 33 % | |
3 | 0 % | |
2 | 0 % | |
1 | 0 % |


