
คำอธิบาย
📈 ตัวบ่งชี้ Divergency v1.1 สำหรับ cTrader: คู่มือฉบับสมบูรณ์ 🚀
ตัวบ่งชี้ Divergency v1.1 เป็นเครื่องมือที่ทรงพลังออกแบบมาสำหรับแพลตฟอร์ม cTrader เพื่อระบุความเบี่ยงเบนและความสัมพันธ์ระหว่างการเคลื่อนไหวของราคาและออสซิลเลเตอร์ต่างๆ คู่มือนี้ให้คำอธิบายโดยละเอียดเกี่ยวกับโค้ด ฟังก์ชันการทำงาน และคำแนะนำทีละขั้นตอนเกี่ยวกับวิธีการใช้งานอย่างมีประสิทธิภาพ ไม่ว่าคุณจะเป็นมือใหม่หรือเทรดเดอร์ที่มีประสบการณ์ ตัวบ่งชี้นี้สามารถเพิ่มประสิทธิภาพการวิเคราะห์ทางเทคนิคของคุณด้วยการตั้งค่าที่ปรับแต่งได้และสัญญาณภาพ มาดูกันเลย! 🌟
🎯 ภาพรวมของตัวบ่งชี้ Divergency11
ตัวบ่งชี้ Divergency v1.1 วิเคราะห์การเคลื่อนไหวของราคาและพฤติกรรมของออสซิลเลเตอร์เพื่อค้นหา:
- ความเบี่ยงเบนปกติ: สัญญาณการกลับตัวที่เป็นไปได้เมื่อราคาและตัวบ่งชี้เคลื่อนที่ในทิศทางตรงกันข้าม
- ความเบี่ยงเบนที่ซ่อนอยู่: บ่งชี้การต่อเนื่องของแนวโน้มเมื่อราคาและตัวบ่งชี้สอดคล้องกันในรูปแบบที่แตกต่างกัน
- ความสัมพันธ์: เน้นเมื่อราคาและตัวบ่งชี้เคลื่อนที่พร้อมกัน แสดงถึงความแข็งแกร่งของแนวโน้ม
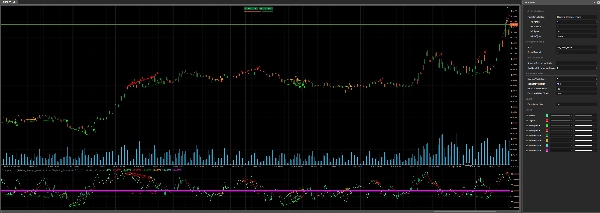
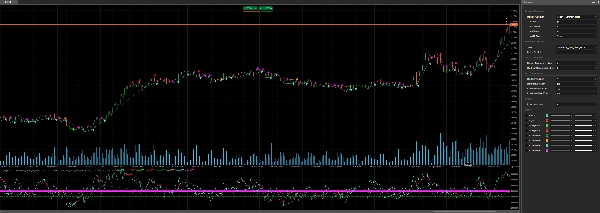
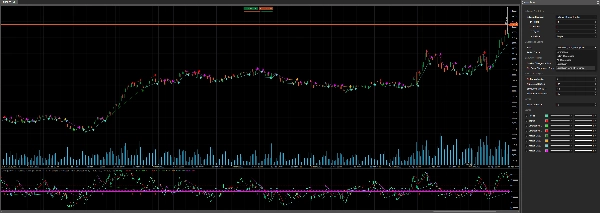
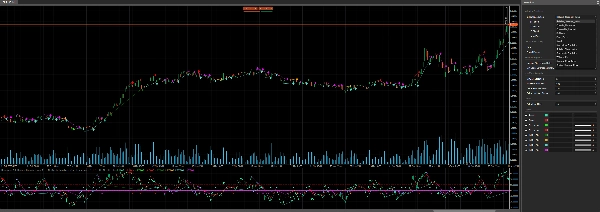
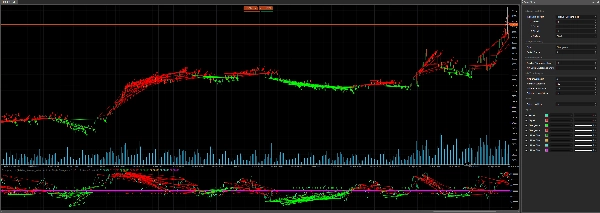
รองรับ ออสซิลเลเตอร์ 12 ชนิดที่แตกต่างกัน (เช่น RSI, MACD, Stochastic) และอนุญาตให้ปรับแต่งพารามิเตอร์การตรวจจับความเบี่ยงเบน ทำให้เหมาะสมกับกลยุทธ์การเทรดหลากหลาย ตัวบ่งชี้จะแสดงสัญญาณโดยตรงบนแผนภูมิและพื้นที่ตัวบ่งชี้ โดยใช้เส้นสี ไอคอน และข้อความเพื่อการแสดงผลที่ชัดเจน 📊
🔍 การแยกส่วนโค้ด
1. การตั้งค่าตัวบ่งชี้ 🛠️
- Namespace และคลาส: กำหนดใน
cAlgonamespace เป็นDivergency v1.1สืบทอดจากIndicator. - แอตทริบิวต์:
-
IsOverlay = false: แสดงในหน้าต่างตัวบ่งชี้แยกต่างหากTimeZone = TimeZones.UTC: ใช้ UTC เพื่อความสอดคล้องAccessRights = AccessRights.None: ไม่ต้องการสิทธิ์พิเศษ
2. พารามิเตอร์ ⚙️
ตัวบ่งชี้มีการปรับแต่งอย่างกว้างขวางผ่านพารามิเตอร์ที่จัดกลุ่มเพื่อความชัดเจน:
- การเลือกออสซิลเลเตอร์:
-
IndicatorSelection: เลือกจากออสซิลเลเตอร์ 12 ตัว (เช่น RSI, MACD, Stochastic) (ปรับให้เป็น 50 เป็นกลาง และผลลัพธ์สูงขึ้นสำหรับกระบวนการเพิ่มประสิทธิภาพ)Value1,Value2,Value3: ปรับช่วงเวลา การทำให้เรียบ และการตั้งค่าสัญญาณMaType: เลือกประเภทค่าเฉลี่ยเคลื่อนที่ (เช่น Simple, Exponential)
- การตั้งค่าความเบี่ยงเบน:
-
Strat: เลือกโหมดการตรวจจับ (Divergence, Hidden Divergence, Correlation หรือการผสมผสาน)PeriodFractal: ตั้งค่าช่วงเวลาฟรัคทัลสำหรับการระบุจุดสูงสุด/ต่ำสุด (ต้องเป็นเลขคี่)LookBack: จำนวนความเบี่ยงเบนในอดีตที่วิเคราะห์MinCountDivergenceShow: จำนวนความเบี่ยงเบนขั้นต่ำที่ต้องการเพื่อแสดงสัญญาณ
- การวิเคราะห์โซน:
-
MinBarsValidation,MaxBarsValidation: กำหนดช่วงแท่งเทียนที่ถูกต้องสำหรับการตรวจจับความเบี่ยงเบนExtraLevelMin,ExtraLevelMax: ตั้งค่าระดับเกินซื้อ/เกินขายของออสซิลเลเตอร์
- ระดับ:
-
ExtraLevelLine: ปรับเส้นเกินขาย/เกินซื้อรอบระดับ 50
3. ผลลัพธ์ 📈
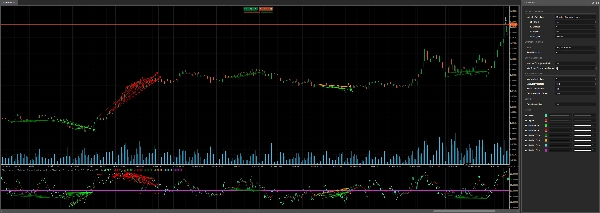
Result: ค่าหลักของออสซิลเลเตอร์ (เส้นสีเขียว)Signal: เส้นสัญญาณที่ทำให้เรียบ (เส้นสีแดง)- สัญญาณความเบี่ยงเบน (แสดงเป็นจุด):
-
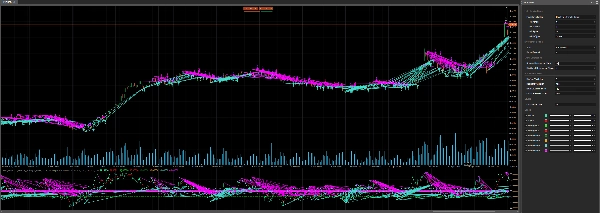
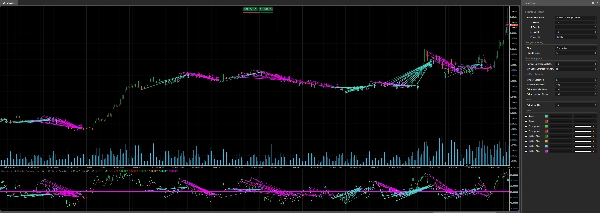
ResDivergenceUp(Lime),ResDivergenceDown(แดง): ความเบี่ยงเบนปกติResDivergenceUpHidden(เขียว),ResDivergenceDownHidden(ส้ม): ความเบี่ยงเบนที่ซ่อนอยู่ResCorrelationUp(ฟ้าอมเขียว),ResCorrelationDown(ม่วงแดง): ความสัมพันธ์
4. ฟังก์ชันหลัก 🧠
- Initialize(): ตั้งค่าตัวบ่งชี้ ตรวจสอบพารามิเตอร์ และวาดเส้นคงที่ (เกินขาย, เกินซื้อ, ศูนย์)
- Calculate(): คำนวณค่าของออสซิลเลเตอร์ ปรับให้เป็นกลางรอบ 50 และตรวจจับฟรัคทัลสำหรับการวิเคราะห์ความเบี่ยงเบน
- GetFractal(): ระบุจุดสูงสุด (fractalUp) และจุดต่ำสุด (fractalDown) ในออสซิลเลเตอร์
- GetDivergence(): วิเคราะห์จุดฟรัคทัลเพื่อค้นหาความเบี่ยงเบนหรือความสัมพันธ์
- CreateLine(): วาดเส้นแนวโน้มและไอคอนสำหรับสัญญาณที่ตรวจพบ
- DawDivergence(): แสดงภาพความเบี่ยงเบนด้วยเส้นและลูกศรบนแผนภูมิและพื้นที่ตัวบ่งชี้
5. คลาสช่วยเหลือ 📋
SRPrice: เก็บข้อมูลฟรัคทัล (ดัชนี ราคา ค่าตัวบ่งชี้)DivergenceFind: ติดตามรายละเอียดความเบี่ยงเบน (ชื่อ เวลา ราคา สี)
6. การจัดการข้อผิดพลาด 🚨
ตัวบ่งชี้ตรวจสอบพารามิเตอร์ที่ไม่ถูกต้อง (เช่น MinBarsValidation > MaxBarsValidation, แม้แต่ PeriodFractal) และแสดงคำเตือนในพื้นที่ตัวบ่งชี้โดยใช้ DrawStaticText.
🛠️ วิธีใช้ตัวบ่งชี้ Divergency11
ขั้นตอนที่ 1: การติดตั้ง 📥
- ดาวน์โหลดโค้ด: คัดลอกโค้ด C# ที่ให้มา
- เพิ่มลงใน cTrader:
-
- เปิด cTrader และไปที่ cAlgo > Indicators.
- คลิก New และวางโค้ดลงในตัวแก้ไข
- สร้างตัวบ่งชี้ (ตรวจสอบว่าไม่มีข้อผิดพลาดในการคอมไพล์)
- นำไปใช้กับแผนภูมิ:
-
- เปิดแผนภูมิใน cTrader
- เพิ่มตัวบ่งชี้ Divergency11 จากรายการตัวบ่งชี้
ขั้นตอนที่ 2: กำหนดค่าพารามิเตอร์ ⚙️
ปรับแต่งการตั้งค่าให้ตรงกับสไตล์การเทรดของคุณ:
- เลือกออสซิลเลเตอร์:
-
- เลือกออสซิลเลเตอร์ (เช่น
Relative_Strenght_Indexสำหรับ RSI) ผ่านIndicatorSelection. - ปรับ
Value1(ช่วงเวลา),Value2(การทำให้เรียบ) และValue3(ช่วงเวลาสัญญาณ) ตามต้องการ
- เลือกออสซิลเลเตอร์ (เช่น
- ตั้งค่าประเภทความเบี่ยงเบน:
-
- ใช้
Stratเพื่อเน้นที่Divergence,Hiden_Divergence,CorrelationหรือAll_Divergence.
- ใช้
- ฟรัคทัลและการย้อนกลับ:
-
- ตั้งค่า
PeriodFractalเป็นเลขคี่ (เช่น 5) เพื่อความสมมาตร - ปรับ
LookBackเพื่อควบคุมจำนวนความเบี่ยงเบนในอดีตที่วิเคราะห์
- ตั้งค่า
- โซนและระดับ:
-
- กำหนดค่า
ExtraLevelMinและExtraLevelMaxสำหรับโซนเกินซื้อ/เกินขาย - ตั้งค่า
ExtraLevelLineเพื่อปรับเกณฑ์การแสดงผล
- กำหนดค่า
ขั้นตอนที่ 3: การตีความสัญญาณ 📊
- ความเบี่ยงเบนปกติ:
-
- ขึ้น (Lime): สัญญาณขาลง (ราคาทำจุดสูงสุดสูงขึ้น ออสซิลเลเตอร์ทำจุดสูงสุดต่ำลง)
- ลง (แดง): สัญญาณขาขึ้น (ราคาทำจุดต่ำสุดต่ำลง ออสซิลเลเตอร์ทำจุดต่ำสุดสูงขึ้น)
- ความเบี่ยงเบนที่ซ่อนอยู่:
-
- ขึ้น (เขียว): การต่อเนื่องของแนวโน้มขาขึ้น (ราคาทำจุดสูงสุดต่ำลง ออสซิลเลเตอร์ทำจุดสูงสุดสูงขึ้น)
- ลง (ส้ม): การต่อเนื่องของแนวโน้มขาลง (ราคาทำจุดต่ำสุดสูงขึ้น ออสซิลเลเตอร์ทำจุดต่ำสุดต่ำลง)
- ความสัมพันธ์:
-
- ขึ้น (ฟ้าอมเขียว): แนวโน้มขาขึ้นที่แข็งแกร่ง (ราคาและออสซิลเลเตอร์เพิ่มขึ้นพร้อมกัน)
- ลง (ม่วงแดง): แนวโน้มขาลงที่แข็งแกร่ง (ราคาและออสซิลเลเตอร์ลดลงพร้อมกัน)
- สัญญาณภาพ:
-
- เส้นแนวโน้มเชื่อมจุดความเบี่ยงเบนบนแผนภูมิและตัวบ่งชี้
- ลูกศรแสดงทิศทางสัญญาณ (ขึ้น/ลง)
- ข้อความแสดงจำนวนความเบี่ยงเบนที่ตรวจพบ (ถ้า
LookBack > 1)
ขั้นตอนที่ 4: กลยุทธ์การเทรด 💡
- การเทรดกลับตัว:
-
- ใช้ความเบี่ยงเบนปกติ (Lime/แดง) เพื่อหาจุดกลับตัวที่เป็นไปได้
- ยืนยันด้วยตัวบ่งชี้อื่นๆ (เช่น แนวรับ/แนวต้าน รูปแบบแท่งเทียน)
- การต่อเนื่องของแนวโน้ม:
-
- ความเบี่ยงเบนที่ซ่อนอยู่ (เขียว/ส้ม) เป็นสัญญาณการต่อเนื่องของแนวโน้ม
- เข้าทำการเทรดในทิศทางของแนวโน้มหลังจากการดึงกลับ
- ความแข็งแกร่งของแนวโน้ม:
-
- ความสัมพันธ์ (ฟ้าอมเขียว/ม่วงแดง) ยืนยันแนวโน้มที่แข็งแกร่ง
- ใช้เป็นตัวกรองเพื่อหลีกเลี่ยงการเทรดสวนแนวโน้ม
- กรอบเวลา:
-
- ทำงานได้กับทุกกรอบเวลา แต่กรอบเวลาที่สูงกว่า (H1, H4) ลดเสียงรบกวน
- การจัดการความเสี่ยง:
-
- ตั้งจุดหยุดขาดทุนต่ำกว่าจุดต่ำสุดสวิงล่าสุด (สำหรับการซื้อ) หรือสูงกว่าจุดสูงสุดสวิง (สำหรับการขาย)
- ใช้ ATR (รวมอยู่ในโค้ด) เพื่อกำหนดขนาดตำแหน่ง
ขั้นตอนที่ 5: การเพิ่มประสิทธิภาพ 🔧
- ทดสอบย้อนหลัง: ใช้ฟีเจอร์ทดสอบย้อนหลังของ cTrader เพื่อทดสอบตัวบ่งชี้กับข้อมูลในอดีต
- ปรับพารามิเตอร์: ทดลองกับ
PeriodFractal,LookBackและMinCountDivergenceShowเพื่อลดสัญญาณผิดพลาด - รวมตัวบ่งชี้: ใช้คู่กับตัวบ่งชี้แนวโน้ม (เช่น ค่าเฉลี่ยเคลื่อนที่) หรือเครื่องมือความผันผวน (เช่น Bollinger Bands)
🌟 เคล็ดลับสู่ความสำเร็จ
- เริ่มต้นง่ายๆ: เริ่มด้วยการตั้งค่าเริ่มต้นและออสซิลเลเตอร์ที่คุ้นเคย เช่น RSI
- ฝึกฝนบนบัญชีทดลอง: ทดสอบตัวบ่งชี้บนบัญชีทดลองเพื่อเข้าใจสัญญาณของมัน
- ติดตามการแจ้งเตือน: สังเกตลูกศรและเส้นแนวโน้มเพื่อดำเนินการตามสัญญาณอย่างรวดเร็ว
- หลีกเลี่ยงการเทรดเกินไป: ใช้ความเบี่ยงเบนเป็นส่วนหนึ่งของกลยุทธ์ที่กว้างขึ้น ไม่ใช่แยกเดี่ยว
- อัปเดตอยู่เสมอ: ตรวจสอบการอัปเดตโค้ดหรือความคิดเห็นจากชุมชนในฟอรัม cTrader
⚠️ ปัญหาทั่วไปและวิธีแก้ไข
- ไม่มีสัญญาณปรากฏ:
-
- ตรวจสอบ
MinCountDivergenceShowกับLookBack(ค่าก่อนหน้าต้อง ≤ ค่าหลัง) - ตรวจสอบให้แน่ใจว่า
PeriodFractalเป็นเลขคี่
- ตรวจสอบ
- สัญญาณมากเกินไป:
-
- เพิ่ม
MinCountDivergenceShowหรือลดLookBack. - เข้มงวดขึ้นกับ
MinBarsValidationและMaxBarsValidation.
- เพิ่ม
- ข้อความแสดงข้อผิดพลาด:
-
- ตรวจสอบคำเตือนพารามิเตอร์ในพื้นที่ตัวบ่งชี้ (เช่น
MinBarsValidation > MaxBarsValidation) - แก้ไขการตั้งค่าที่ไม่ถูกต้องและนำตัวบ่งชี้ไปใช้ใหม่
- ตรวจสอบคำเตือนพารามิเตอร์ในพื้นที่ตัวบ่งชี้ (เช่น
🎉 สรุป
ตัวบ่งชี้ Divergency v1.1 เป็นเครื่องมือที่หลากหลายและแข็งแกร่งสำหรับผู้ใช้ cTrader ให้ข้อมูลเชิงลึกลึกซึ้งเกี่ยวกับความสัมพันธ์ระหว่างราคาและออสซิลเลเตอร์ ด้วยการตั้งค่าที่ปรับแต่งได้และผลลัพธ์ภาพที่ชัดเจน มันช่วยให้เทรดเดอร์สามารถระบุการกลับตัว การต่อเนื่อง และความแข็งแกร่งของแนวโน้มได้อย่างมั่นใจ ลองใช้ ปรับพารามิเตอร์ และผนวกเข้ากับแผนการเทรดของคุณเพื่อยกระดับการวิเคราะห์ของคุณ! 🚀
ขอให้เทรดอย่างมีความสุข และขอให้แผนภูมิของคุณเขียวชอุ่มเสมอ! 📈💚
สรุป
- Regular divergences signaling potential reversals when price and oscillator move oppositely.
- Hidden divergences indicating trend continuation with differing price and oscillator alignments.
- Correlations highlighting synchronized movements suggesting trend strength.
Signals are displayed on the chart and indicator window using colored lines, icons, and text for clarity. Visual cues include trend lines connecting divergence points and arrows indicating signal direction. Key functions handle initialization, calculation of normalized oscillator values, fractal detection, divergence analysis, and drawing of signals.
Users can configure overbought/oversold zones and adjust lookback periods to tailor signal sensitivity. The indicator works on any timeframe, with higher timeframes recommended to reduce noise. It includes error handling for invalid parameters and provides guidance for installation, parameter setup, signal interpretation, and trading strategies such as reversal and trend continuation. Backtesting and parameter optimization are supported within cTrader to refine performance.
รีวิวจากลูกค้า
5 | 100 % | |
4 | 0 % | |
3 | 0 % | |
2 | 0 % | |
1 | 0 % |


