
说明
蜡烛压力指数(CPI)是一种强大且易于使用的指标,旨在揭示每根蜡烛背后隐藏的买卖压力。它不仅仅显示价格是上涨还是下跌,而是深入挖掘买方或卖方在每根蜡烛中对市场的控制力度。这使其成为识别趋势强度、提前发现反转以及更准确确认进出点的独特工具。
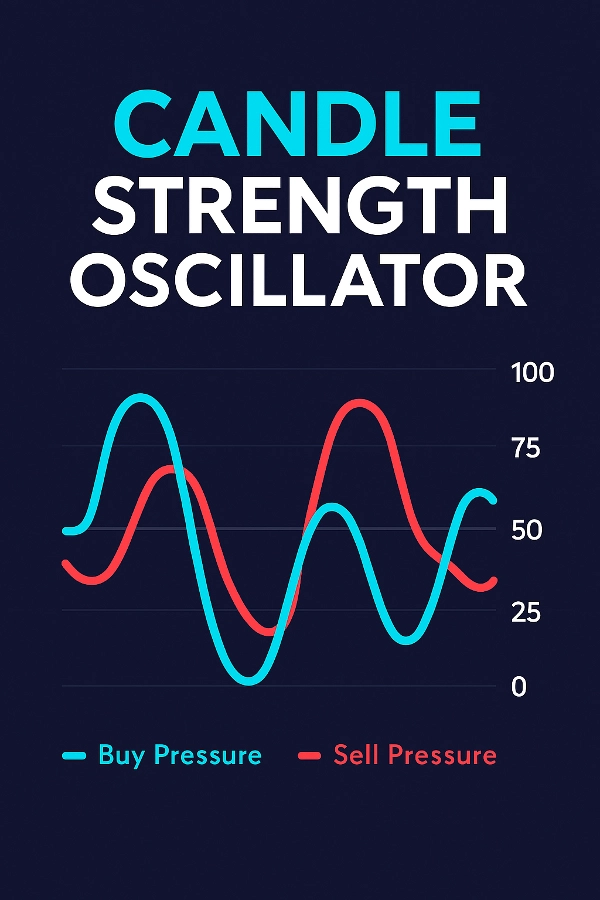
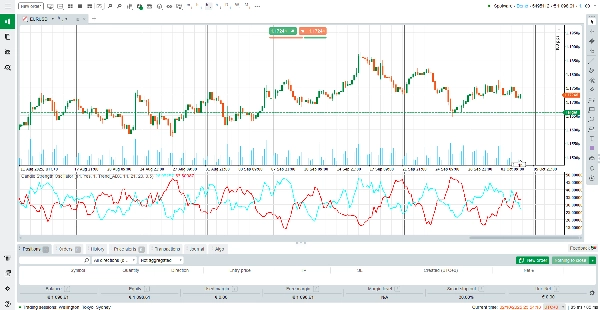
与仅对价格作出反应的传统振荡器不同,CPI结合了蜡烛实体动态、动量、成交量加权和趋势分析(ADX或EMA),为您提供市场压力的全面视角。通过两条平滑线——买入压力(青色)和卖出压力(红色)——交易者可以立即看到市场的主导方。
如何读取指标
买入压力(青线)——代表多头控制的强度。上升的线条显示买方主导力增强。
卖出压力(红线)——代表空头控制的强度。上升的线条显示卖方力量增强。
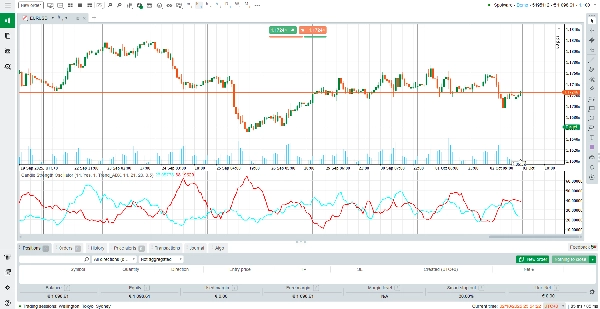
交叉点——当买入线穿越卖出线向上时,表示多头压力增强(潜在买入机会)。当卖出线穿越买入线向上时,空头压力占优(潜在卖出机会)。
50水平区——读数接近中间(约50)表示买卖双方平衡,而极端读数(高于75或低于25)显示强烈的方向性压力。
趋势因子增强——指标根据ADX或EMA斜率的趋势确认调整信号,减少横盘市场中的假信号。
指标工作原理
CPI使用加权模型计算压力,考虑以下因素:
蜡烛结构:实体大小及收盘位置相对于最高/最低价。
动量:与前一根蜡烛相比的价格变动。
成交量:成交量加权确保高成交量的变动更具重要性。
趋势确认:ADX强度或EMA斜率为信号添加增强因子,使其与当前趋势保持一致。
平滑处理:用户定义的SMA滤波器确保线条平滑且稳定,同时保持响应性。
这一先进的公式意味着CPI不仅对价格作出反应,还能理解价格变动的原因——为交易者提供更深入的市场行为洞察。
主要特点
双线可视化——通过颜色编码的线条(买方为青色,卖方为红色)即时比较买卖压力。
自适应趋势增强——整合ADX或EMA确认趋势方向,减少假信号。
成交量感知计算——按成交量加权,突出真实市场参与支持的变动。
平滑且清晰的显示——内置SMA滤波器,确保读数平滑且无滞后失真。
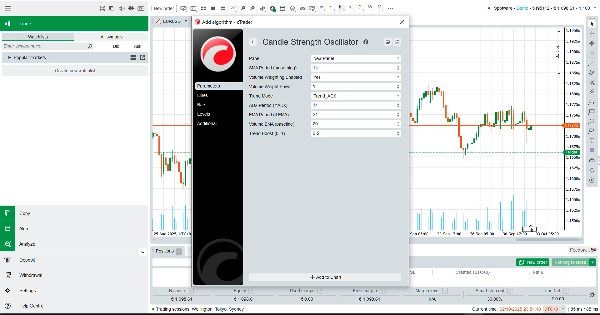
完全可定制——可调节周期、加权和增强强度,适应任何交易风格。
为什么使用蜡烛压力指数?
CPI非常适合希望超越简单价格行为,洞察买卖双方真实较量的交易者。无论您是短线交易者、波段交易者还是趋势跟随者,这个免费指标都能为您提供所需的清晰度,以把握入场时机、管理风险,并与市场的真实方向保持一致。
立即下载蜡烛压力指数(CPI)——通过了解驱动每根蜡烛的隐藏力量,自信交易。
摘要
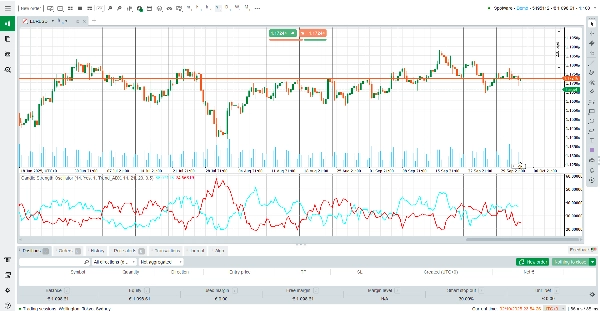
The indicator displays two smooth lines: Buy Pressure (cyan) and Sell Pressure (red). Crossovers between these lines signal shifts in market dominance, helping traders identify trend strength, potential reversals, and optimal entry or exit points. Readings near the midpoint indicate balance, while extremes suggest strong directional pressure.
CPI incorporates volume-weighted calculations and trend-based boosts to reduce false signals during sideways markets. It includes a smoothing filter for stable, responsive readings and offers customization of periods, weighting, and trend boost intensity.
This tool is applicable across various markets including Forex, commodities, stocks, and cryptocurrencies, supporting trading strategies such as scalping and breakout trading. It aims to provide traders with enhanced insight into market dynamics beyond simple price action.
客户评价
5 | 0 % | |
4 | 100 % | |
3 | 0 % | |
2 | 0 % | |
1 | 0 % |


