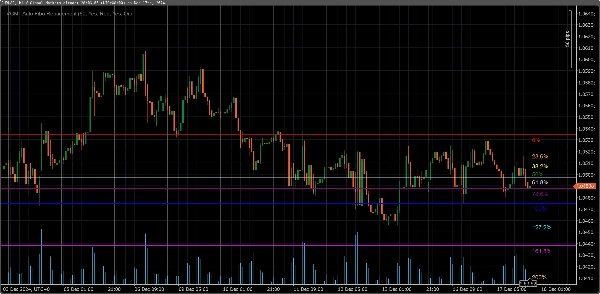
经纪商和自营
面向企业
00
Days
:
00
Hours
:
00
Minutes
:
00
Seconds
VGM - Auto Fibo Retracement
"VGM - Auto Fibo Retracement" 标识
注册日期 17/12/2024
免费安装
896
"VGM - Auto Fibo Retracement" 已上传图片

This Auto Fibonacci Retracement Indicator automatically calculates and draws Fibonacci retracement levels on the chart based on the highest high and lowest low within a customizable lookback period. Users can configure colors and enable/disable specific Fibonacci levels, including popular extensions above 100% such as 127.2%, 161.8%, 200%, and 261.8%.

Key Features:
1. **Automatic Swing Detection**: Detects swing highs and lows dynamically within the chosen lookback period.
2. **Customizable Levels**: Enable/disable specific Fibonacci levels as per preference.
3. **Color Settings**: Choose individual colors for each level for better visual distinction.
4. **Extended Levels**: Includes commonly used extensions (127.2%, 161.8%, 200%, and 261.8%) for trend continuation analysis.
5. **Real-Time Updates**: Levels automatically adjust to changes in market conditions.

Ideal For:
- Traders using Fibonacci retracement and extensions for entry/exit levels.
- Users who need a clean, flexible, and automated Fibonacci tool.


Build by VantoFX. https://vantofx.com Free for all.

4.5
评价:2
5
50 %
4
50 %
3
0 %
2
0 %
1
0 %
客户评价
August 10, 2025
This is helpful my friend, thanks for the upload :)
July 9, 2025
Pros: Automatically detects swing points and plots Fibonacci retracement levels. Easy to use, customizable, works across timeframes. Cons: No tooltips or alerts. Lacks template saving and historical swing tracking. Requires additional confirmation tools for reliable trading.
猜您喜欢
指标
Indices
Commodities
Stocks
+4
LT_Ind_Candles
Most used candle patterns. (1 candle, 2 candles and 3 candles patterns) and Marubozu. Bonus Fibo Risk control.
指标
Signal
Hammer Pattern Indicator
指标
VWAP
ZigZag
RSI
+6
RSI T3 overbought and oversold area
指标
NAS100
Indices
Breakout
+7
ORB Range with FVGs
This indicator plots the 15m opening range of the NY session with the first N FVGs presented on the chart after the open
指标
NAS100
NZDUSD
XAUUSD
+13
Chandelier Exit
Optimize exits with Chandelier Exit! Visualize stop-loss points dynamically for improved trading precision and safety.
指标
Forex
VegaXLR - Market Sessions Alerts
The cTrader Market Sessions Alerts Indicator marks global sessions, highlights key levels, and sends real-time alerts.
指标
RSI
Breakout
Supertrend
Market Trend OB
Price action to detect when the market changes trend (MSB) and defines, order blocks , ZigZag etc.📊
指标
Indices
Stocks
Commodities
+2
Series - FXMaster
Consecutive Series Moves — Reveal the True Pulse of Price Action
评分最高
免费
BarSentiments
This Indicator is a technical analysis tool that measures the strength and direction of market sentiment
指标
Grid
Fibonacci
Simple Pivot Points
Clear pivot levels. Clean S/R zones. Five methods. Any timeframe.
指标
Indices
Stocks
Commodities
+2
DayOfWeek - FXMaster
Day of Week Indicator for cTrader
指标
NAS100
NZDUSD
Breakout
+13
Meridian Pivot Points Pro
🚀See the market’s framework, decide faster. Session-Aware Pivots. Auto Presets. Pro-Grade Zones.🚀
指标
RSI
Breakout
XAUUSD
+12
Stop Loss Professional
Stop Loss Pro – Precision Risk Management for Every Trader
指标
NAS100
Indices
XAUUSD
+4
BSL_SSL_Liqudity
Buy-Side & Sell-Side Liquidity (BSL/SSL) Indicator
MTF Candles
Multi Timeframe Candle drawing. Draw Any candles from any timeframe on your chart :-)
Laguerre RSI
Laguerre RSI is based on John EHLERS' Laguerre Filter to avoid the noise of RSI.
指标
Indices
Prop
Commodities
+3
LT_Ind_TradeNet
Personal trade tracker for a single symbol. Clear net profit summary — FreshNet, ManageNet, DayNet, WTDNet, MTDNet.
指标
NAS100
NZDUSD
Martingale
+26
Pattern Scanner
Patter Scanner all Chart Let your chart tell you when patterns appear