
说明
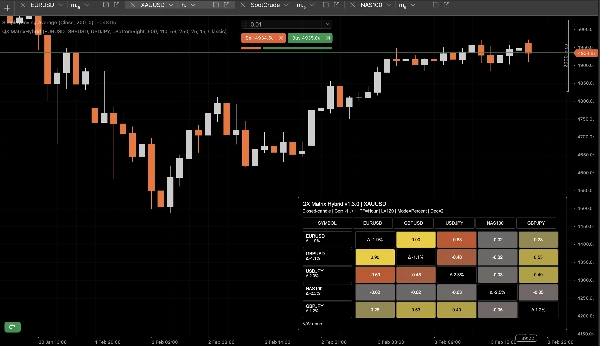
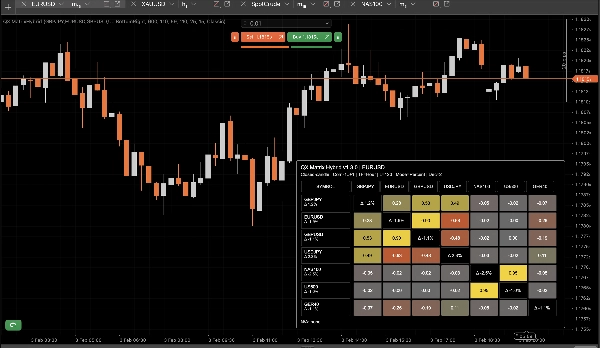
QX Matrix Hybrid 是一个视觉指示器,显示一个 多资产相关矩阵 作为一个清晰的 热图面板。它帮助您即时识别哪些工具一起移动,哪些相反移动,以及您可能在市场中无意中重复暴露的地方。
主要功能
- 相关矩阵(-1 到 +1) 使用 Pearson 相关 计算符号之间的关系。
- 收益模式:
-
- 百分比收益
- 对数收益
- 每个符号的强度(Δ%): 显示每个符号在回溯窗口内的表现(在行标签中,且可选地在对角线上)。
- 自动文本对比: 文本颜色根据背景亮度自动调整以提高可读性。
- 主题 + 自定义调色板: 多种预设加上完整的自定义颜色选择控件。
- 灵活的面板布局: 角落停靠、宽度、单元格大小、边距、行高控制。
- 智能页脚: 列出缺失/不可用的符号,支持可配置的截断。
性能与更新逻辑
即使有多个符号,也能保持响应速度:
- 每符号缓存 Symbol 和 Bars 对象,避免重复的 API 调用。
- 自动缓存失效 当 Symbols CSV 或 TimeFrame 发生变化时。
- 仅闭合蜡烛 模式以最小化 CPU 负载(在新闭合的柱上更新)。
- 可选 更新节流(毫秒) 用于实时模式。
如何使用
参数(高级)
- Symbols CSV,TimeFrame,Lookback
- 收益模式(百分比/对数),小数位数,对数自动小数位
- 仅闭合蜡烛,更新节流
- 显示强度(Δ%),显示页脚,页脚最大缺失数
- 面板布局(角落、宽度、单元格大小、边距)
- 颜色 / 主题(包括自定义调色板)
注意事项
- 仅用于可视化。不执行任何订单。
- 如果您的经纪商/服务器上不可用,或所选时间框架/回溯历史不足,符号可能显示 N/A。
摘要
AI 摘要
QX MatrixHybrid is a real-time visual indicator that presents a multi-asset correlation matrix as a heatmap panel. It displays Pearson correlation coefficients ranging from -1 to +1 between up to 12 selected symbols, helping users identify strong positive correlations, inverse relationships, and low correlations for diversification or hedging purposes. The indicator supports multiple return modes, including percent and log returns, and tracks each symbol’s performance over a configurable lookback period, showing strength as percentage change.
The interface offers full customization with multiple color themes and a custom palette, adjustable panel layout options (such as docking, cell size, and margins), and automatic text contrast for readability. It includes a smart footer that lists missing or unavailable symbols with configurable truncation.
Performance optimizations include per-symbol caching to reduce API calls, automatic cache invalidation on symbol or timeframe changes, and a "Closed Candle Only" mode to minimize CPU load by updating only on new closed bars. An optional update throttle controls live update frequency.
QX MatrixHybrid is designed for use across various markets including forex, indices, commodities, metals, and cryptocurrencies. It is a visualization tool only and does not place orders. Symbols may show as unavailable if data is insufficient or missing.
指标配置
客户评价
4.6
评价:3
5 | 67 % | |
4 | 33 % | |
3 | 0 % | |
2 | 0 % | |
1 | 0 % |
客户评价
February 12, 2026
The part that matters is bad ideas get easier to avoid, and 20 signals is a fair first sample.
February 9, 2026
Two sessions say more than one clean chart, and weak ideas are easier to skip.
February 5, 2026
Ngl, weak ideas are easier to skip and that is enough to keep testing it. Price action still has to agree.
讨论
常见问答
Signal
Indices
Commodities
GBPUSD
RSI
Bollinger
Fibonacci
Scalping
AI
XAUUSD
NAS100
MACD
BTCUSD
Forex
Breakout
EURUSD
NZDUSD
Martingale
Prop
ZigZag
Supertrend
Fair Value Gap
SMC
Crypto
Grid
Stocks
ATR
USDJPY
VWAP
cTrader Store 提供的所有产品,包括交易机器人、指标和插件,均由第三方开发者提供,仅供信息参考和技术访问之用。cTrader Store 并非经纪商,不提供投资建议、个人推荐或任何未来业绩保证。


!["[Hamster-Coder] Bollinger Bands" 标识](https://cdn.ctrader.com/image/webp/21d8e5d6-fb11-4bac-b9ee-cd05c2b76804_30327)


价格
41.97M
交易量
208.53K
盈利点数
13
销售
354
免费安装